Page History
| Anchor | ||||
|---|---|---|---|---|
|
| Table of Contents | ||
|---|---|---|
|
...
概要
| Styleclass | ||
|---|---|---|
|
...
The purpose of the tutorials and reference materials outlined on this page is to assist you in undertaking a guided tutorial of Yellowfin. As you navigate through the tutorials, you may come across technical terms that you find yourself unfamiliar with. When this is the case, explore our Glossary, which contains a wide variety of definitions for commonly used terms and concepts.
Ski Team Tutorial Data
The tutorials and examples will make use of the tutorial content database (Ski Team), which can be included as part of the installation process. The data has been structured to provide a similar experience to that you may have had when reporting from many operational databases.
Ski Team is a ski tourism business that organises ski trips in various locations around the world and markets these to its existing clients. The Ski Team database contains information relating to the core tourism business. It contains details of the camps run, the athletes who attended those camps, and campaigns associated with sourcing athletes. In addition it does contain financial information related to the amount invoiced and received for each client taking part in ski trips.
The data in this database will assist managers of Ski Team to understand the profitability of each of their programs, identify who their most profitable clients are and better manage their best performing camps.
Core Tables
The main tables used in Ski Team examples are:
Athlete Fact | This contains information about each athlete and their participation on a camp. In this database the person fact will generally have one record for each camp and each person for every year. The fact record is concerned about the individual trips for each program. |
Camp | This is a dimensional table which contains information about each camp. For example the name and location of the camp. Camp ID is the Key to this table. |
Person | The person table contains information about the athlete such as name and address details. Person ID is the Key to this table. |
Yellowfin Components
Yellowfin is designed to reuse components, such as Source Connections and Views, as much as possible. This model creates a hierarchy of objects within Yellowfin and understanding this hierarchy will assist you with this tutorial.
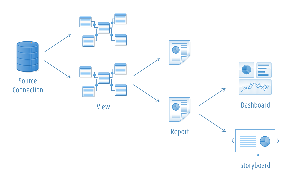
Source Connections | A source connection stores details of how Yellowfin will connect to an external database that you wish to report from. For every database that you wish to write reports for, you will have to create a single source connection record within Yellowfin. |
|---|---|
Views | Once you have defined a source connection you must create one or more view records that your users can report off. |
Reports | Once a view is defined you can write a report against it. A report record is a report definition which defines which columns in your database you want to display and how you want to display them. |
Dashboard Tabs | Once you have written reports, you can begin to construct your dashboard. You can place as many reports onto a tab as you wish. You can also create as many tabs as you wish on your own personal dashboard. |
Storyboards | Storyboard is a presentation layer in Yellowfin that allows users to create slide shows with fully functional reports as well as text, images, and videos. |
Introductory Tutorials
| Styleclass | ||
|---|---|---|
| ||
When first starting to use Yellowfin, you will need to learn how to setup, login, and navigate the system. This set of tutorials is designed to get you into the system, and ready to begin building content.
Content Creation Basics Tutorials
| Styleclass | ||
|---|---|---|
| ||
Once you've logged in for the first time, you will need to start building content. This set of tutorials walks you through the basics of content creation from Data Source through to Discussion Topic.
Report Basics Material
| Styleclass | ||
|---|---|---|
| ||
The material in this section will provide you with information about some of the basic functionality available in the Report Builder. Build on the creation basics explored in the previous section.
Chart Tutorials
| Styleclass | ||
|---|---|---|
| ||
Once you've started writing reports, you will need to learn how to add charts to enhance your report display. Explore the tutorials below to learn how to create specific visualisations.
Analytical Charts
Standard Charts
- Area Charts
- Bar Charts
- Column Charts
- Combination Charts
- Financial Charts
- Line Charts
- Meter Charts
- Pie Charts
| Styleclass | ||
|---|---|---|
| ||
Maps |
Special Purpose Charts
Dashboard Tutorials
| Styleclass | ||
|---|---|---|
| ||
When you've created sets of reports and charts you will need to learn how to group and display these together through use of the dashboard. Explore the following tutorials to learn how to create and link up content through dashboard tabs.
- Basic Standard Tab
- Pre-Built Tab
- Standard Tab with Analytic Links
- Standard Tab with Series Selection
- KPI Tab
Advanced Report Concepts
| Styleclass | ||
|---|---|---|
| ||
Once you explored the tutorials outlined above, you may find you need to implement some advanced concepts to achieve more detailed and complex report results.
Related Reports Material
KPI Reports Tutorials
Sub Queries Tutorials
...
| Wiki Markup |
|---|
{html}<iframe width="700" height="394" src="https://www.youtube.com/embed/Tzu2Mzr9pNQ?color=white" frameborder="0" allowfullscreen></iframe>{html} |
Ski Teamチュートリアルデータ
チュートリアルや例では、チュートリアルコンテンツデータベース(Ski Team)を使用します。このデータベースは、インストールプロセスでインストールすることができます。データは、多くの実稼働データベースからレポートを作成したときと同様な体験を得られるように構造化されています。
Ski Teamは、世界中のさまざまな場所へのスキー旅行を主催し、既存の顧客へのスキー旅行のマーケティングを行う観光企業です。Ski Teamデータベースには、基幹の観光ビジネスに関する情報が格納されています。このデータベースには、キャンプ運営、これらのキャンプに参加するアスリート、およびアスリートの募集に関連したキャンペーン詳細情報が含まれています。さらに、スキー旅行に参加した各顧客に対する請求額や受領額に関連した財務情報が含まれています。
このデータベース内の情報により、Ski Teamのマネージャーは同社の各プログラムの収益性をより詳細に理解できるようになり、最も収益が高い顧客を特定できるようになり、最適なキャンプ運営をより効率良く管理できるようになります。
コアテーブル
Ski Teamの例で使用する主要なテーブルは以下の通りです:
Athlete Fact | このテーブルには、各アスリートのキャンプへの参加状況の情報が含まれています。このデータベースでは、各キャンプおよび各個人に対応した1つのレコードが参加情報となり、これが年次に記録されています。このレコードは、各プログラムの個別の旅行を対象としています。 |
|---|---|
Camp | このテーブルは、各キャンプに関する情報を含む多次元テーブルです。たとえば、キャンプの名前、場所などの情報が含まれています。「Camp ID」がこのテーブルのキーになります。 |
Person | 名前や詳細な住所など、アスリートの情報を含むテーブルです。「Person ID」がこのテーブルのキーになります。 |
Yellowfinの構成要素
Yellowfinは、ソース接続やビューなどの構成要素を可能な限り再利用するように設計されています。このモデルは、Yellowfin内でオブジェクトの階層を作成します。この階層を理解すると、チュートリアルの理解が深まります。
ソース接続 | ソース接続は、Yellowfinがレポートの作成元となる外部データベースに接続する方法の詳細を保存します。レポートの作成元となるすべてのデータベースについて、Yellowfin内にソース接続レコードを1つ作成する必要があります。 |
|---|---|
ビュー | ソース接続を定義したら、ユーザーがレポートを作成できる1つまたは複数のビューレコードを作成する必要があります。 |
レポート | ビューを定義したら、そのビューに対するレポートを作成できます。レポートレコードは、データベース内の表示するカラム(列)およびその表示方法を定義するレポート定義です。 |
ダッシュボードタブ | レポートを作成したら、ダッシュボードの構成が可能になります。任意の必要な数のレポートを配置することができます。また、個人用のダッシュボードには、任意の必要な数のタブを作成できます。 |
ストーリーボード | ストーリーボードは、Yellowfinのプレゼンテーションレイヤーです。ユーザーはフル機能のレポートに加え、テキスト、イメージおよび動画を使用したスライドショーを作成できます。 |
基礎的なチュートリアル
| Styleclass | ||
|---|---|---|
| ||
コンテンツ作成の基礎的なチュートリアル
| Styleclass | ||
|---|---|---|
| ||
レポートの基礎的な資料
| Styleclass | ||
|---|---|---|
| ||
グラフのチュートリアル
| Styleclass | ||
|---|---|---|
| ||
分析グラフ
標準的なグラフ
| Styleclass | ||
|---|---|---|
| ||
マップ |
特殊用途グラフ
ダッシュボードのチュートリアル
| Styleclass | ||
|---|---|---|
| ||
高度なレポートの概念
| Styleclass | ||
|---|---|---|
| ||
関連レポートの資料
KPIレポートのチュートリアル
サブクエリーのチュートリアル
...
| horizontalrule |
|---|
| Styleclass | ||
|---|---|---|
|
...