Page History
...
| Table of Contents | ||
|---|---|---|
|
...
概要
| Styleclass | ||
|---|---|---|
| ||
Layout | Description |
|---|---|
Column | The most common form of table output, all fields added are displayed as a column in the table layout, with the field name used as the column header. |
Row | A variant the column layout, all fields added are displayed as a row in the table layout, with the field name used as the row header. |
Cross Tab | A special layout that allows you to summarise data by using both Column and Row headers with Metric fields making up the body of the table. This display is sometimes referred to as a Pivot. |
...
レイアウト | 説明 |
|---|---|
カラム(列) | 最も一般的な表出力の形式であり、追加されるすべてのフィールドがテーブルレイアウトのカラム(列)として表示されます。その際、フィールド名がカラムヘッダーとして使用されます。 |
ロウ(行) | カラムレイアウトの変形であり、追加されるすべてのフィールドがテーブルレイアウトのロウ(行)として表示されます。その際、フィールド名がロウヘッダーとして使用されます。 |
クロス集計 | カラム(列)とロウ(行)の見出しの両方を使用してデータを集約することができる特別なレイアウトで、表の内容がメトリック(数値)フィールドで構成されます。この表示はピボットと呼ばれることもあります。 |
カラム(列)ベース
| Styleclass | ||
|---|---|---|
| ||
You can display the variable labels along the top row of the table so that you read the data down the columns as shown below:
When to Use Column Based Tables
A column table is a sequential, two-dimensional list. This doesn't imply that the data in a table is simple or uncomplicated: you can present a great deal of data in a table. The layout of columns within a table is directly related to the layout of the items within the columns data list. Yellowfin places the cells in the table in the same order in which they appear in the report columns list.
Suitable for - Presenting data in a tabular, two dimensional list.
Note: arrange the items in the order you want them to appear in the column list. For example, if you want each row to have a location, headcount and basic pay, in that order, arrange the data items in that order in the Columns list.
Yellowfinの表は、行と列でデータが表示され、ヘッダーとフッターが付加されています。ヘッダーとフッターは行と列の特別な形で、ヘッダーにはたとえば表示されている値の名前やラベルなどの情報、フッターには値の行、あるいは列ごとの集計結果が表示されます。カラム(列)ベースの表では、以下の図のように、表のトップに各カラムのデータのラベルが、その下の各行にその実際のデータが表示されます。
カラム(列)ベースの表では、以下の図のように、表のトップに各カラムのデータのラベルが、その下の各行にその実際のデータが表示されます。
カラム(列)ベースの表を使用する場合
カラム(列)ベースの表は連続的な2次元の一覧で、複雑なデータを含んでおらず、多量のデータを表示することができます。カラム(列)のレイアウトはレポートデータ上のアイテムのレイアウトと直結しています。つまりレポートのカラム一覧に並べられたとおりの順番でデータが表示されるわけです。
用途:2次元のデータを表示する
注意: 表示するアイテムはカラム(列)の一覧で表示順を指定します。たとえば各行に場所、人数、基本給の順にデータを表示する場合には、「カラム(列)」一覧でこの順序となるようにデータアイテムを配置します。
ロウ(行)ベース
...
| Styleclass | ||
|---|---|---|
| ||
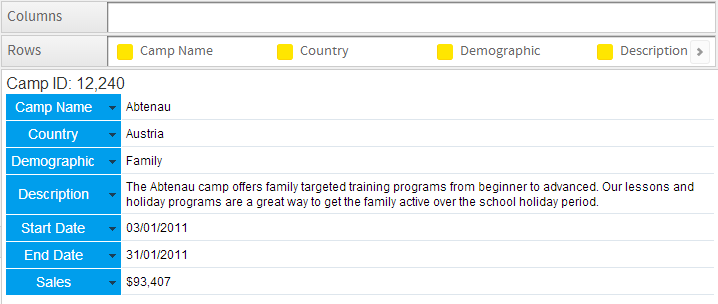
They are also often used to list information based on a particular customer, site, product, using sections so that there is a table of information for each item. See the example below:
When to Use Row Based Tables
A Row table is similar to a Column table, but the header and information are displayed vertically, instead of horizontally. When you set the report type to Row, the Row Edit Field looks identical to the Dimensions Edit Field. However, when the report is run the data will be displayed in rows rather than columns.
Suitable for - Presenting data in a vertical format.
Note: arrange the items in the order you want them to appear in the Rows list.
...
ロウ(行)ベースの表では、以下の図のように、表の左端に各ロウのデータのラベルが、その右の各列にその実際のデータが表示されます。この形式は財務レポートやデータのハイライトが必要な場合によく使用されます。
また、通常、セクションを使用して特定の顧客、サイト、および製品に基づいた情報を一覧表示するためにも使用されるため、アイテムごとに情報の表が存在します。以下の例を参照してください:
ロウ(列)ベースの表を使用する場合
ロウ(行)ベースの表はデータが縦に表示されているだけで、基本的にカラム(列)ベースの表と同じです。表の種類に「ロウ(行)ベース」を選択すると、レポートデータの「カラム(列)フィールド」が「ロウ(行)フィールド」に変わり、レポート実行時には選択されたアイテムが各行に表示されます。
用途:2次元データを縦に表示する
注意: 表示するアイテムはロウ(行)の一覧で表示順を指定します。
クロス集計表
| Styleclass | ||
|---|---|---|
| ||
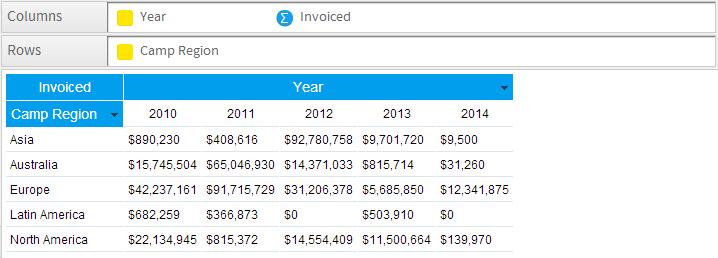
The example below displays the total invoiced amount collected in each region, broken down by year. The values at the intersection points of rows and columns show summarised information.
Note:
- arrange the items in the order you want them to appear in the Column and Row lists.
- metric items cannot be used in the vertical or horizontal headers; they can only be used in the body of the cross tab table.
- metrics can be added to either the Columns or Row lists in order to populate the summary body of the table, but if using multiple metrics they must all be added to the one list.
...
以下の例では、各地域で収集された合計請求金額を年ごとに分割して表示しています。こうすることで地域の比較と同時に、年ごとの変化も追跡することができます。ロウとカラムの交点には集約した値が表示されます。
注意:
- 表示するアイテムはカラムとロウの一覧で別々の表示順序を指定します。
- 縦横どちらのヘッダーにもメトリック(数値)データを指定することはできません。それらはクロス集計表の内容にのみ使用できます。
- メトリック(数値)は、表のサマリー内容にデータを投入するためにカラムまたはロウのいずれかの一覧に追加することができますが、複数のメトリック(数値)を使用している場合は、すべてのメトリック(数値)を1つの一覧に追加する必要があります。
クロス集計表の設定
| Styleclass | ||
|---|---|---|
| ||
| Wiki Markup |
|---|
{html}<iframe width="700" height="394" src="https://www.youtube.com/embed/Ysj9oQcAsYgJOvX-foqVek?color=white" frameborder="0" allowfullscreen></iframe>{html} |
Basic Cross Tab
A basic cross tab table will have only one row dimension, one column dimension and one metric specified.

Drag the dimensions and metrics that you wish to display in your cross tab table. You must have a dimension in both the Column and Row lists, and a metric, for the cross tab report to populate.
Advanced Cross Tabs
To create more advanced cross tab tables you can add additional metrics or dimensions to your report data. However, consideration needs to be taken into account of the complexity of the data output that is being created.
Two or More Measures in the Cross Tab
To include more than 1 metric in your cross tab table drag an additional metric next to the original in the same list (either Columns or Rows).
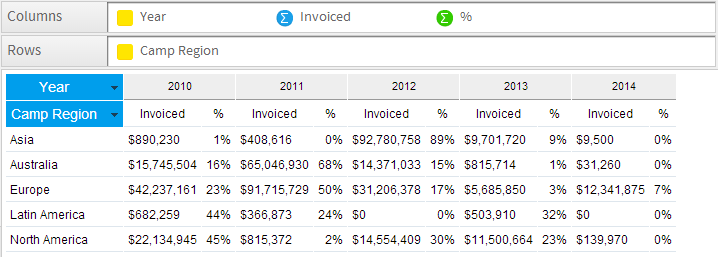
In this example Sum Invoiced Amount and % of Total Invoiced Amount are used.
- There are now two metrics displayed in the table. They span the column heading. E.g. Each value of Year has two corresponding metrics
- The metric title has moved into the table body as well.
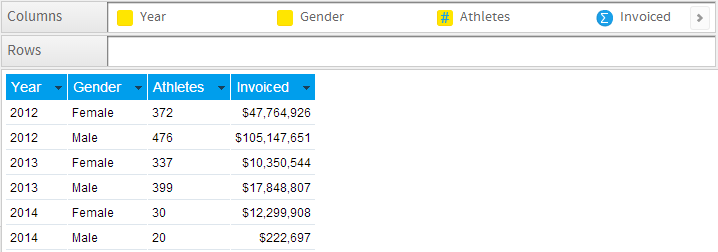
Two or More Dimensions
To include more than one Row or Column Dimension onto your report drag an additional dimension into the Rows or Columns list.
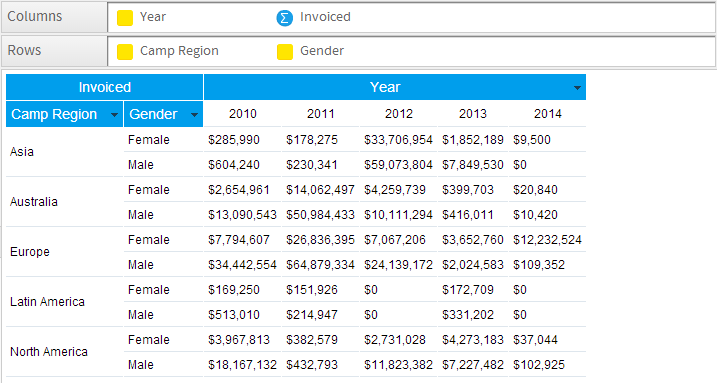
In this example Camp Region and Gender have been used as Rows.
基本的なクロス集計
基本的なクロス集計表には、ロウ、カラムともに1つずつのディメンション(次元)が指定され、1つのメトリック(数値)が指定されます。
クロス集計表で表示するディメンション(次元)、メトリック(数値)データをそれぞれのフィールドにドラッグ&ドロップします。クロス集計レポートにデータを投入するには、カラムとロウの両方の一覧にディメンション(次元)が指定されている必要があります。
高度なクロス集計
レポートデータの各フィールドにディメンション(次元)やメトリック(数値)データを追加することでさらに高度なクロス集計を行うことができます。もちろんそれにより、表示されるデータが複雑になることは理解しておく必要があります。
クロス集計での複数のメトリック(数値)の表示
クロス集計表に複数のメトリック(数値)を組み込むには、追加のメトリック(数値)を同じ一覧(カラムまたはロウ)内の元のメトリック(数値)の横にドラッグします。
この例では、請求金額の合計と合計請求金額の%が使用されています。
- 表には、2つのメトリック(数値)が表示されています。上の2つのメトリック(数値)が「Year」の下のカラムを分割しているように2つのメトリック(数値)はカラムヘッダーを分割して表示されます。
- メトリック(数値)のタイトルは表の内容に移動します。
複数のディメンション(次元)
レポートのロウまたはカラムに複数のディメンション(次元)を設定するには、ロウまたはカラムの一覧に追加ディメンション(次元)をドラッグします。
この例では、「Camp Region」と「Gender」がロウ(行)として使用されています。
- ロウに2つのディメンション(次元)が表示されます。「Camp Region」が最初に表示されているため、セカンダリディメンション(次元)である「Gender」によって表のロウが分割されています。
- レポートには必要なだけのディメンション(次元)を追加することができます。
- Two row dimensions are now displayed. As Camp Region is listed first, it is broken up in the table by Gender, the secondary dimension.
- As many dimensions as required can be added to a report.
| horizontalrule |
|---|
| Styleclass | ||
|---|---|---|
| ||