Page History
| Anchor | ||||
|---|---|---|---|---|
|
| Table of Contents | ||
|---|---|---|
|
...
概要
| Styleclass | ||
|---|---|---|
| ||
- The type of builder you use
- The data source you build on
- The fields you use in the report, and the layout defined by them
- The filters and/or sections you add to the report
- The addition of Related Reports, Drill Functionality, and Sub Queries
- 使用するビルダーの種類
- 作成時のベースとなるデータソース
- レポートで使用するフィールドおよびフィールドで定義されたレイアウト
- レポートに追加したフィルターまたはセクション(あるいはその両方)
- 関連レポート、ドリル機能、およびサブクエリーの追加
| Wiki Markup |
|---|
{html}
<iframe width="700" height="394" src="https://www.youtube.com/embed/ShuNDvM88HQ?color=white" frameborder="0" allowfullscreen></iframe>{html} |
レポートビルダーのステップ
...
| Styleclass | ||
|---|---|---|
| ||
Create
The first step in building any report is selecting the type of report you wish to run and the data source required. Your organisation may have many views and data sources so selecting the correct one is critical prior to building your report.
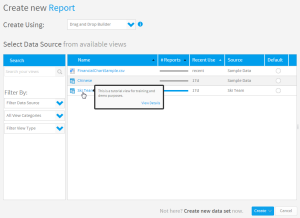
See Initialise Report for more information.
Data
The report data section allows you to define the look and feel of your report, including the fields to be displayed, the filters to be used, and whether a chart or drill through should be displayed. Select the items from the view that you wish to include in your report and drag them into the appropriate section of the screen.
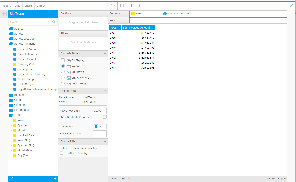
Note: depending on the builder you select, this option may be replaced with alternatives such as; CSV, SQL, Jasper, and BIRT.
See Report Data for more information.
Charts
The Charts page allows you to build visualisations based on the table created in the Data step.
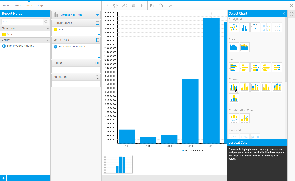
See Charts for more information.
Related Reports
Create relationships between the draft report and other content using Drill Through and Co-Display reports.
See Related Reports for more information.
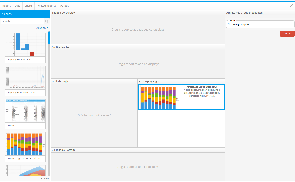
Output
The Output page allows you to format the report, set up a multi-chart canvas, and other functions.
作成
どんなレポートを作成する場合でも、最初のステップはレポートの種類とデータベースの指定です。表示される選択肢から作成したいレポートに必要なものを選びます。
詳細については、新規レポート作成を参照してください。
データ
レポートデータのステップでは、表示するフィールド、適用するフィルター、グラフやドリルスルーを使用するかどうかなどレポートのルック&フィールを設定します。データフィールドから必要なアイテムを、レポートデータ欄の適当なセクションにドラッグ&ドロップしてください。
注意:このオプションは、選択するビルダーに応じてCSV、SQL、Jasper、BIRTなどの代替オプションに置き換わる場合があります。
詳細については、レポートデータを参照してください。
グラフ
「グラフ」ページを使用すると、「データ」ステップで作成した表に基づいてグラフで表示することができます。
詳細については、グラフを参照してください。
関連レポート
ドリルスルーレポートやマルチ表示レポートを使用して、ドラフト(編集中)レポートと他のコンテンツとの間の関係を作成します。
詳細については、関連レポートを参照してください。
表示
「表示」ページを使用すると、レポートの書式を設定したり、マルチグラフのキャンバスやその他の機能を設定したりすることができます。
| horizontalrule |
|---|
| Styleclass | ||
|---|---|---|
| ||