Page History
| Anchor | ||||
|---|---|---|---|---|
|
| Table of Contents | ||
|---|---|---|
|
...
概要
| Styleclass | ||
|---|---|---|
|
...
Advanced Functions are used to transform results by applying post processing calculations to the initial query results. These functions are database independant as they are performed by Java code, rather than being part of the SQL query.
Available Functions
利用可能な関数
Yellowfinは定義済みの関数を備えています。しかしながら、管理者は組織やレポートにのニーズに合わせて専用の関数を追加することもできます。以下の項目を展開すると、使用可能な関数の一覧が表示されます。
Yellowfin comes with a set of pre-defined functions. However, your administrator may add in additional functions specifically for your organisation or reporting needs. Expand the following to see the lists of functions available:
| Expand | |
|---|---|
|
...
Accumulative Percentage | Will print a running percentage for the values returned. A maximum of 100% will be displayed. |
Accumulative Total | Will print out a running total for the data returned. |
Ascending Rank | The highest value returned will be displayed as a 1. Used where the preferable result is a higher value. Eg. Profit. |
Bottom 10 Rank | The bottom 10 values (lowest) are returned. |
Bottom N Rank | The bottom N values (lowest) are returned- user is prompted to define number to return. |
Delta from Last | Calculate change between consecutive rows |
Delta from Last N | Calculate change between the current row and row - N |
Descending Rank | The lowest value returned will be displayed as a 1. Used where the preferable result is a lower value. Eg. Expenses. |
Difference of Columns | Returns difference of two selected columns |
Multiplication of Columns | Returns multiplication of two selected columns |
Natural Logarithm | Gives the base e logarithm of the values of a given field. |
Natural Logarithm | Gives the base e logarithm of the values in the field. |
Percentage Against Absolute Maximum | Returns percentage of selected field according to an absolute maximum value. |
Percentage Against Column | Creates a percentage ration of values in the selected column compared to another column. |
Percentage Against Maximum | Returns the % of the attribute when compared to the maximum value of the attribute within the dataset. |
Percentage of Total | Returns the % of the attribute when compared to the total summed value of the attribute for the entire dataset. |
Sum of Columns | Returns the sum of two selected columns. |
Top 10 Rank | The top 10 values (highest) are returned. |
Top N Rank | The top N values (highest) are returned - user is prompted to define number to return. |
Top N With Ties | Returns top values for the selected field with provision for tied values. This means that if there are multiple records per ranking it will restrict it to N total rankings. |
| ||||||||||||||||||||||||||||||||||||||||||
|
| Expand | ||||||||||||||
|---|---|---|---|---|---|---|---|---|---|---|---|---|---|---|
| ||||||||||||||
|
| Expand | ||||||||||||||||||||||||||||||
|---|---|---|---|---|---|---|---|---|---|---|---|---|---|---|---|---|---|---|---|---|---|---|---|---|---|---|---|---|---|---|
| ||||||||||||||||||||||||||||||
|
| Expand | ||
|---|---|---|
| ||
|
| Expand | ||
|---|---|---|
| ||
データ変換によって、データベースから結果が返されたときに結果を調整することができます。このデータ変換は、たとえばデータベースに格納されている通貨価格を、全桁の通貨価格から1000で除算した(千円単位の)通貨価格に変換する場合に使用することができます。 |
関数の適用
| Styleclass | ||
|---|---|---|
| ||
レポートビルダー - 「データ」ステップ
高度な関数を初めて適用する場合、この関数を適用するフィールドが表に追加されていることを確認する必要があります。関数を適用する場合には、表内のフィールドのコピーが2つ必要となる場合があります。1つは元の値(販売数値など)を表示するためのコピー、もう1つは適用する関数(販売数値の最上位から10位を表示する関数など)を含むコピーです。
レポートビルダーの「データ」ステップから、表内のフィールドに関数を適用するには、以下の手順を実行します。
- 以下のいずれかの場所で、フィールドのドロップダウンメニューを開きます。
- カラムとロウの一覧から

- 表のプレビューから
- カラムとロウの一覧から
- ここで、一覧から「高度な関数」オプションを選択し、「高度な関数」表示を開きます。
- ここで、関数オプションを入力する必要があります。
- フィールドに適切な集計を適用します。これにより、必要なすべての集計の最上位にこの関数が適用されます。
- 「分析」、「統計関数」、および「テキスト」から、使用する関数タイプを選択します。
- 一覧から、使用する関数名を選択します。選択すると、関数の横にその説明が表示されます。一部の関数には追加のパラメーターが必要です。追加のパラメーターは、関数を選択した後に定義する必要があります。
- 関数が「グラフ」ページにのみ表示されるように設定することもできます。これにより、関数を適用するフィールドの追加のコピーを表示目的で作成する際に、追加のフィールドで表が煩雑にならないようにすることができます。
- 定義したら、「保存」をクリックして関数を適用します。
レポートビルダー - 「グラフ」ステップ
レポートビルダーの「グラフ」ステップから、表内のフィールドに関数を適用するには、以下の手順を実行します。
- ページの左下にある「+」ボタンをクリックします。
- 「高度な関数」を選択して、使用するフィールドを一覧から選択し、「高度な関数」表示を開きます。
- ここで、関数オプションを入力する必要があります。
- フィールドに適切な集計を適用します。これにより、必要なすべての集計の最上位にこの関数が適用されます。
- 「分析」、「統計関数」、および「テキスト」から、使用する関数タイプを選択します。
- 一覧から、使用する関数名を選択します。選択すると、関数の横にその説明が表示されます。一部の関数には追加のパラメーターが必要です。追加のパラメーターは、関数を選択した後に定義する必要があります。
- 関数が「グラフ」ページにのみ表示されるように設定することもできます。これにより、関数を適用するフィールドの追加のコピーを表示目的で作成する際に、追加のフィールドで表が煩雑にならないようにすることができます。
- 定義したら、「保存」をクリックして関数を適用します。
レポートビルダー - 「表示」ステップ
レポートビルダーの「表示」ステップから、表内のフィールドに関数を適用するには、以下の手順を実行します。
- フィールドのドロップダウンメニューを開きます。
- ここで、一覧から「高度な関数」オプションを選択し、「高度な関数」表示を開きます。
- ここで、関数オプションを入力する必要があります。
- フィールドに適切な集計を適用します。これにより、必要なすべての集計の最上位にこの関数が適用されます。
- 「分析」、「統計関数」、および「テキスト」から、使用する関数タイプを選択します。
- 一覧から、使用する関数名を選択します。選択すると、関数の横にその説明が表示されます。一部の関数には追加のパラメーターが必要です。追加のパラメーターは、関数を選択した後に定義する必要があります。
- 関数が「グラフ」ページにのみ表示されるように設定することもできます。これにより、関数を適用するフィールドの追加のコピーを表示目的で作成する際に、追加のフィールドで表が煩雑にならないようにすることができます。
- 定義したら、「保存」をクリックして関数を適用します。
データ変換の適用
| Styleclass | ||
|---|---|---|
| ||
- 前述のセクションで説明したように、「高度な関数」表示を開きます。
- 「データ変換」タブを選択します。適用する変換の種類を選択するインターフェースが表示されます。
- 変換に適した集計を選択します。
- 「追加」ボタンをクリックし、変換を選択して適用します。これで、選択したデータタイプに使用可能な変換の一覧が表示されます。デフォルトでは、Java date converterとNumeric divide convertor(1000で除算することができるなど)のコンバーターが組み込まれています。
- 画面に表示されるコンバーターの指示に従って操作し、「保存」をクリックします。
- 注意:必要に応じて、「追加」リンクをクリックして新しいタイプを作成すれば、複数のコンバーターをデータタイプに追加することができます。
| horizontalrule |
|---|
| Styleclass | ||
|---|---|---|
| ||
| Expand | ||||||||||||||
|---|---|---|---|---|---|---|---|---|---|---|---|---|---|---|
| ||||||||||||||
|
| Expand | ||||||||||||||||||||||||||||||
|---|---|---|---|---|---|---|---|---|---|---|---|---|---|---|---|---|---|---|---|---|---|---|---|---|---|---|---|---|---|---|
| ||||||||||||||||||||||||||||||
|
| Expand | ||
|---|---|---|
| ||
|
| Expand | ||
|---|---|---|
| ||
Data Conversion allows you to adjust results once they've returned from the database. For example you may wish to convert a currency value which is stored in the database from a full currency value to a ('000) where the value is divided by 1000. This transformation can be achieved using the data conversion. |
Applying a Function
| Styleclass | ||
|---|---|---|
| ||
Report Builder - Data Step
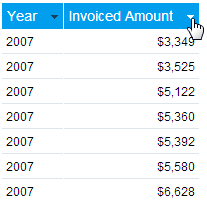
To apply and advanced function first you will need to ensure the field you wish to apply it to has been added to your table. Often, when applying functions, you may find you need two copies of the field in your table; one to display the original values (such as sales figures) and the second to have a function applied to it (for example, displaying the top 10 rank of sales figures).
To apply a function to a field in your table from the Data step of the report builder, complete the following:
- Open the field's drop down menu, in either of these locations:
- Through the Columns/Rows list
- Through the Table Preview
- Through the Columns/Rows list
- Now select the Advanced Function option from the list, opening the Advanced Function display.
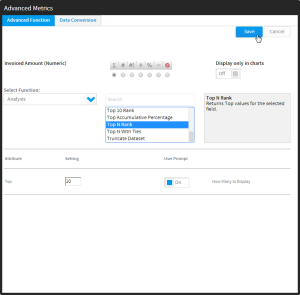
- You will now need to complete the function options:
- Apply the appropriate aggregation to the field. This ensures the function is applied on top of any aggregations necessary.
- Select which function type you wish to use, from Analysis, Statistical, and Text
- Select the name of the function you wish to use from the list. Once selected, you will see a description of the function displayed next to it. Some functions require extra parameters, which will need to be defined once the function has been selected.
- You also have the option to set the function to only display on the Charts page. This allows you to create additional copies of a field to apply functions to for graphical purposes, without cluttering your table with extra fields.
- When defined, click Save to apply the function.
Report Builder - Charts Step
To apply a function to a field in your table from the Charts step of the report builder, complete the following:
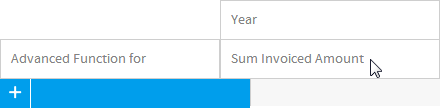
- Click on the + button at the bottom left of the page
- Select Advanced Function for and choose the field you wish to use from the list, opening the Advanced Function display.
- You will now need to complete the function options:
- Apply the appropriate aggregation to the field. This ensures the function is applied on top of any aggregations necessary.
- Select which function type you wish to use, from Analysis, Statistical, and Text
- Select the name of the function you wish to use from the list. Once selected, you will see a description of the function displayed next to it. Some functions require extra parameters, which will need to be defined once the function has been selected.
- You also have the option to set the function to only display on the Charts page. This allows you to create additional copies of a field to apply functions to for graphical purposes, without cluttering your table with extra fields.
- When defined, click Save to apply the function.
Report Builder - Output Step
To apply a function to a field in your table from the Output step of the report builder, complete the following:
- Open the field's drop down menu
- Now select the Advanced Function option from the list, opening the Advanced Function display.
- You will now need to complete the function options:
- Apply the appropriate aggregation to the field. This ensures the function is applied on top of any aggregations necessary.
- Select which function type you wish to use, from Analysis, Statistical, and Text
- Select the name of the function you wish to use from the list. Once selected, you will see a description of the function displayed next to it. Some functions require extra parameters, which will need to be defined once the function has been selected.
- You also have the option to set the function to only display on the Charts page. This allows you to create additional copies of a field to apply functions to for graphical purposes, without cluttering your table with extra fields.
- When defined, click Save to apply the function.
Applying Data Conversion
| Styleclass | ||
|---|---|---|
| ||
Data in a field can be converted by completing the following:
- Open the Advanced Function display, as outlined in the sections above.
- Choose the 'Data Conversion' tab. This will provide you with the interface to use to select the conversion you wish to apply.
- Choose the aggregation appropriate for you conversion.
- Click Add button to select and apply a conversion - this will present you with a list of possible conversions for the data type you have selected. By default there is a java date converter and a Numeric divide converter (This lets you divide a value by 1000's etc).
- Follow the on screen instructions for the converter and click Save.
- Note that you can add multiple converters to a data type if required by clicking the add link and creating a new type.
| horizontalrule |
|---|
...
| Class | topLink |
|---|
...