Page History
| Anchor | ||||
|---|---|---|---|---|
|
| Table of Contents | ||
|---|---|---|
|
...
はじめに
| Styleclass | ||
|---|---|---|
|
...
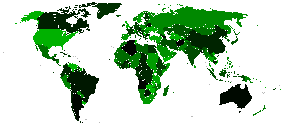
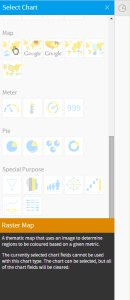
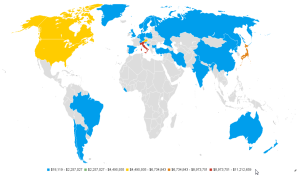
There are two styles of heat maps available using Yellowfin. Those created from GIS data or those created via an image (Raster Map). The image will contain all the regions for your data. These images work by substituting a unique colour in your image with a new colour based on the value of data in your report.
To begin making Raster Maps you will need to have:
- An image with each ‘Zone’ defined by a unique colour (JPG or PNG)
- Reference Code data that allows you to match each map zone to reference data. (In the tutorial we have Country as a Ref Code – so that we can map each zone to a country code which will then be used for our data).
Note: the examples contained in this Getting Started section do not use the Ski Team data or supplied image. The examples for you to follow along with begin in the Setting up a Map via Administration Options section.
Selecting the Right Image
When setting up a Raster Map, selecting the right image means more than just finding an image that depicts the data in your data set. In the initial search there are some criteria your image should attempt to meet:
- The image should contain all areas you wish to assign data to. For example, if you wanted to map revenue by states of Australia, you would need a full map of Australia. A World map would not be suitable here, nor would a map of half of Australia.
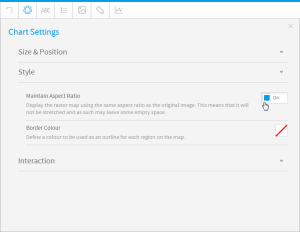
- The image should only contain elements you wish to be displayed in the final map. This means that if you found a map of Australia, the image should not contain a background of surrounding water and land masses unless you wish these areas to be displayed in the final map.
Note: any area that does not have data assigned to it will display as found in the original image. - The image should be of a high enough resolution so that you can resize the final map without losing clarity. This means that the image needs to be the size you wish to display your final map, or larger, so that edges and backgrounds do not appear blurred when resized.
...
ラスターマップの作成を開始するには、次のものが必要です。
- それぞれの「区域」が異なる色で定義されたイメージ(JPGまたはPNG)
- 参照しているデータと各マップの区域を一致させることができる参照コード(チュートリアルでは、参照コードとして国を使用します。これらのデータを使用するために、国コードに各区域をマッピングします。)
注意:この「はじめに」セクションに含まれる例では、Ski Teamデータや提供済みのイメージは使用しません。管理オプションを介してマップの設定のセクションから、例の手順に従ってください。
| Wiki Markup |
|---|
{html}<iframe width="700" height="394" src="https://www.youtube.com/embed/6oJesNPiANg?color=white" frameborder="0" allowfullscreen></iframe>{html} |
適切なイメージの選択
ラスターマップを設定する場合、適切なイメージの選択とは、データセット内のデータを示すイメージを見つけることだけを意味しているわけではありません。初期検索で、イメージが満たしているべきいくつかの条件があります。
- イメージにデータを割り当てるすべてのエリアが含まれている必要があります。たとえば、オーストラリアの州別に収益をマッピングするには、オーストラリア全体の地図が必要です。この場合、世界地図も、オーストラリアの半分だけが載っている地図も適していません。
- イメージには、最終的にマップグラフに表示する要素だけが含まれている必要があります。つまり、オーストラリアの地図を見つけた場合、そのイメージには、背景として周囲の海域や大陸が含まれている必要はありません(それらのエリアを最終的にマップグラフに表示する場合を除きます)。
注意:データを割り当てていないエリアは元のイメージのとおりに表示されます。 - 鮮明さを失うことなく最終的にマップグラフをサイズ調整できるように、イメージは十分に高画質である必要があります。つまり、サイズ調整時に端と背景が不鮮明にならないように、イメージを最終的なマップグラフの表示サイズまたはそれより大きいサイズにする必要があります。
例
| Section | ||||||||||
|---|---|---|---|---|---|---|---|---|---|---|
|
| Section | ||||||||||
|---|---|---|---|---|---|---|---|---|---|---|
|
| Section | ||||||||||
|---|---|---|---|---|---|---|---|---|---|---|
|
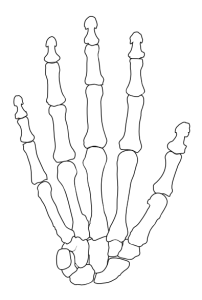
When you have a clean image you are ready to start assigning colours to the data areas.
Note: the cleaning process will require the use of image editing software.
...
クリーンなイメージが用意できたら、いつでもデータをエリアの色へ割り当てることができます。
注意:クリーンなイメージを作成するには、イメージ編集ソフトウェアを使用する必要があります。
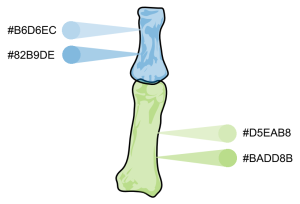
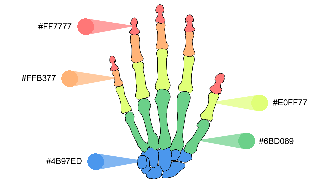
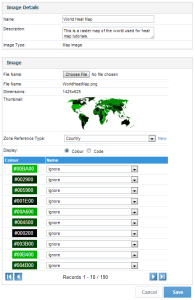
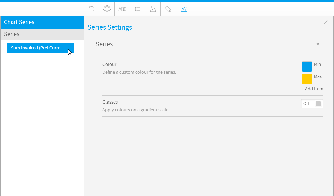
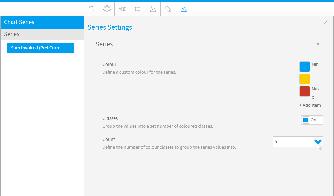
イメージへの色の割り当て
| Section | ||||||||||
|---|---|---|---|---|---|---|---|---|---|---|
|
| Section | ||||||||||||||||||||||||||||||||||
|---|---|---|---|---|---|---|---|---|---|---|---|---|---|---|---|---|---|---|---|---|---|---|---|---|---|---|---|---|---|---|---|---|---|---|
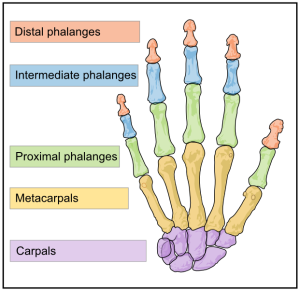
| Carpals |
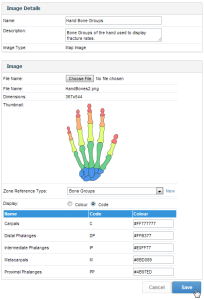
Note: colouring the image will require the use of image editing software.
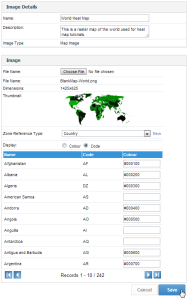
Creating your Corresponding Org Ref Code
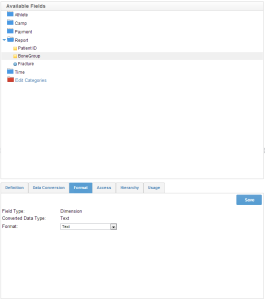
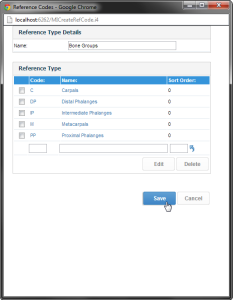
The last preparation step before creating your Map in Yellowfin is setting up an Org Reference Code. In this example you need to create a reference code based on the Bone Group data.
You will need to either;
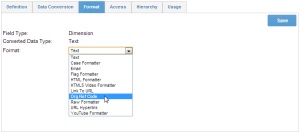
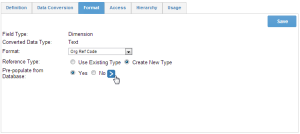
- Edit the view you wish to base your map on and edit the appropriate field, opening the Format tab. OR
- Create a new reference code in the Add Image process and ensure you apply the code to the corresponding field in the report builder.
|
注意:イメージの色付けには、イメージ編集ソフトウェアを使用する必要があります。
対応する参照コードの作成
Yellowfinでマップを作成する前の最後の準備ステップは、参照コードの設定です。この例では、骨グループのデータに基づいて参照コードを作成する必要があります。
次のいずれかを実行する必要があります。
- マップの基になるビューを編集し、「書式」タブを開いて適切なフィールドを編集します。または
- イメージの追加プロセスで新しい参照コードを作成し、レポートビルダーでコードを対応するフィールドに適用します。
この例では、ビュービルダーで参照コードを設定します。In this example we will set up the Reference Code in the View Builder.
| Section | ||||||||||
|---|---|---|---|---|---|---|---|---|---|---|
|
| Section | ||||||||||
|---|---|---|---|---|---|---|---|---|---|---|
|
| Section | ||||||||||
|---|---|---|---|---|---|---|---|---|---|---|
|
| Section | ||||||||||
|---|---|---|---|---|---|---|---|---|---|---|
|
| Section | ||||||||||
|---|---|---|---|---|---|---|---|---|---|---|
|
See Organisation Reference Codes for more information.
詳細については、参照コードを参照してください。
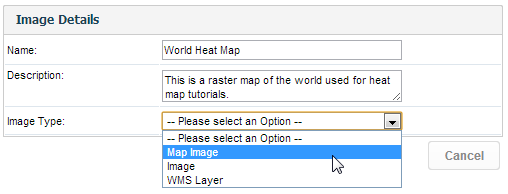
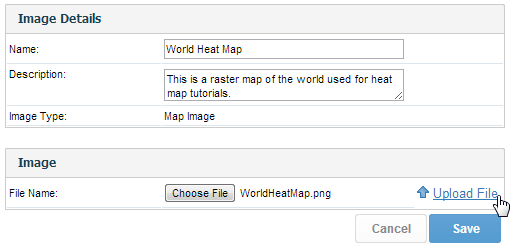
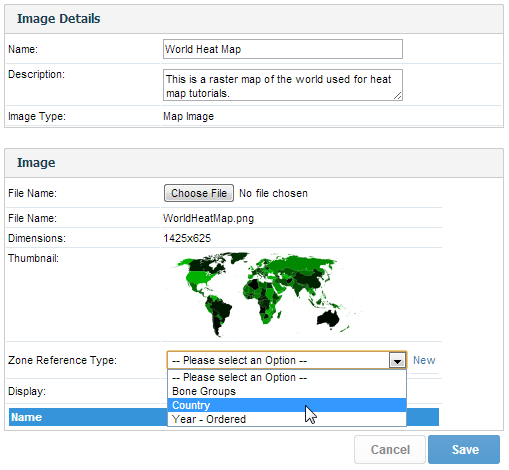
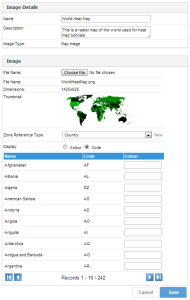
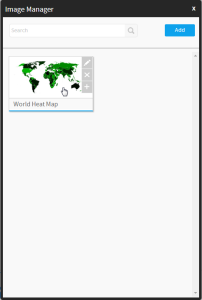
管理オプションを介したマップの設定
...
| Styleclass | ||
|---|---|---|
|
...
| Section | ||||||||||
|---|---|---|---|---|---|---|---|---|---|---|
|

| Section | ||||||||||
|---|---|---|---|---|---|---|---|---|---|---|
|
| Section | ||||||||||
|---|---|---|---|---|---|---|---|---|---|---|
|
| Section | ||||||||||
|---|---|---|---|---|---|---|---|---|---|---|
|

| Section | ||||||||||
|---|---|---|---|---|---|---|---|---|---|---|
|
| Section | ||||||||||
|---|---|---|---|---|---|---|---|---|---|---|
|
| Section | ||||||||||
|---|---|---|---|---|---|---|---|---|---|---|
|
| Section | ||||||||||
|---|---|---|---|---|---|---|---|---|---|---|
|
| Section | ||||||||||
|---|---|---|---|---|---|---|---|---|---|---|
|
| Section | ||||||||||
|---|---|---|---|---|---|---|---|---|---|---|
|
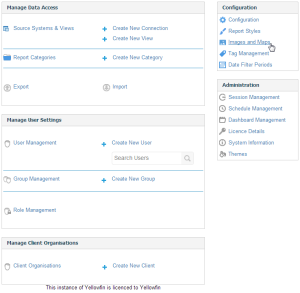
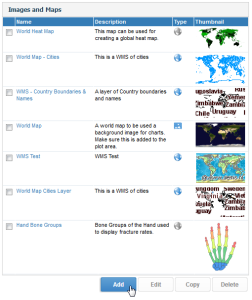
See Images & Maps for more information.
...
詳細については、イメージとマップ を参照してください。
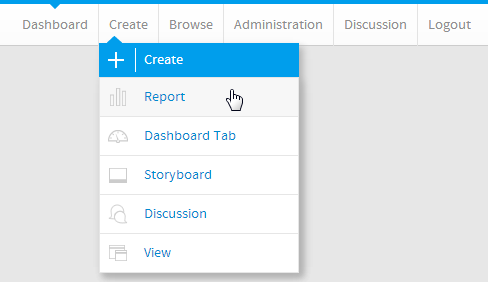
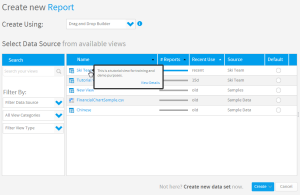
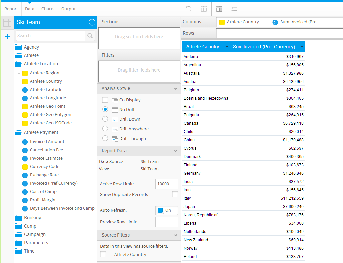
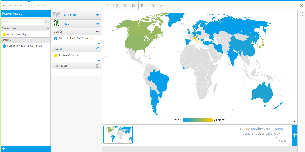
レポートへのヒートマップの追加
| Styleclass | ||
|---|---|---|
|
...
| Section | ||||||||||
|---|---|---|---|---|---|---|---|---|---|---|
|
| Section | ||||||||||
|---|---|---|---|---|---|---|---|---|---|---|
|
| Section | ||||||||||
|---|---|---|---|---|---|---|---|---|---|---|
|
| Section | ||||||||||
|---|---|---|---|---|---|---|---|---|---|---|
|
| Section | ||||||||||
|---|---|---|---|---|---|---|---|---|---|---|
|
| Section | ||||||||||
|---|---|---|---|---|---|---|---|---|---|---|
|
| Section | ||||||||||
|---|---|---|---|---|---|---|---|---|---|---|
|
| Section | ||||||||||
|---|---|---|---|---|---|---|---|---|---|---|
|
| Section | ||||||||||
|---|---|---|---|---|---|---|---|---|---|---|
|
| Section | ||||||||||
|---|---|---|---|---|---|---|---|---|---|---|
|
| Section | ||||||||||
|---|---|---|---|---|---|---|---|---|---|---|
|
| horizontalrule |
|---|
| Styleclass | ||
|---|---|---|
| ||
...