Page History
...
| Table of Contents | ||
|---|---|---|
|
...
概要
| Styleclass | ||
|---|---|---|
| ||
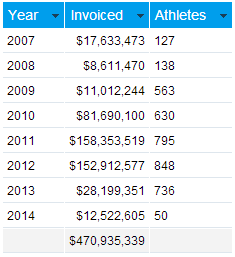
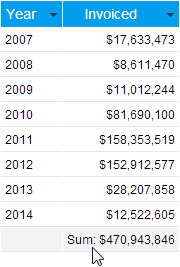
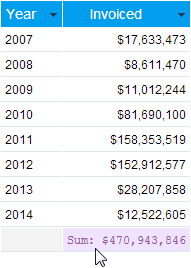
Summaries create aggregated totals in order to provide the user with higher level data as part of a more detailed report. There are several types of summary that can be included in a table:
- Field Totals
- Categorical Sub Totals
- Section Totals
- Section Summary Tables
- Grand Totals
Adding Summaries to a Column Report
| Styleclass | ||
|---|---|---|
| ||
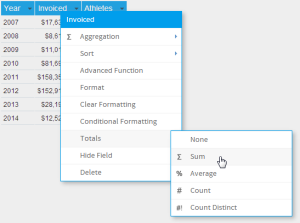
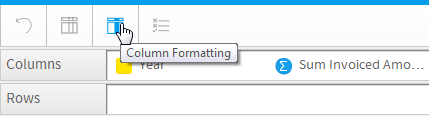
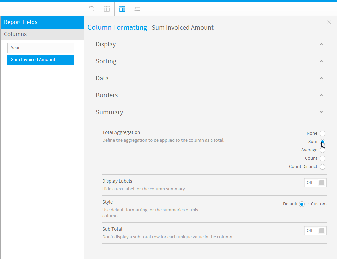
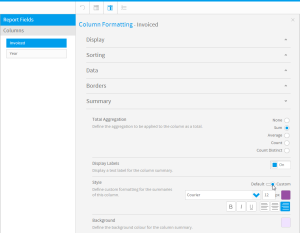
To add a summary to a report you can either use the column format drop down menu or the summary section from the main format menu for you selected column.
Select the format menu and the type of summary you wish to apply. The summary will now be added to you report.
Note: For calculated columns (eg where you have a calculated field such as Sum(Revenue) / Sum(Invoiced) ) you can add a calculated summary. This will create a a calculated summary for accurate results (eg Sum(Sum(Revenue / Sum(Invoiced))
Main Format Menu
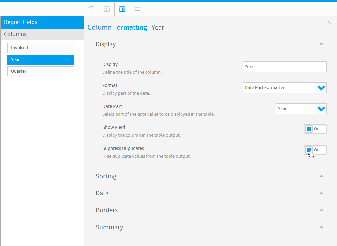
If using the main menu column format drop down you will see the following options:
Option | Description |
|---|---|
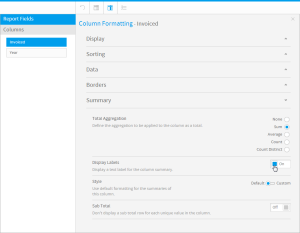
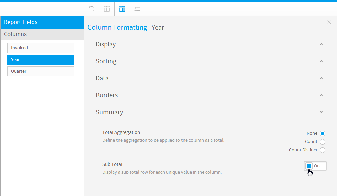
Summaries | Choose the type of summary you wish to apply, Sum, Average, Count. |
Label Summaries | If you want to include a label on the total cell then choose 'Yes'. This will insert a label in front of the summary to indicate the summary type selected above. |
Sub Total | If you wish to apply sub totals to a column you can choose the 'Yes'. Note this will only be applied for every unique value in the column. This option only needs to be added to the field for which you want to see the sub total breakdown. |
Style | The style section lets you apply formatting to your total cells. |
Adding Summaries to Cross Tabs
| Styleclass | ||
|---|---|---|
| ||
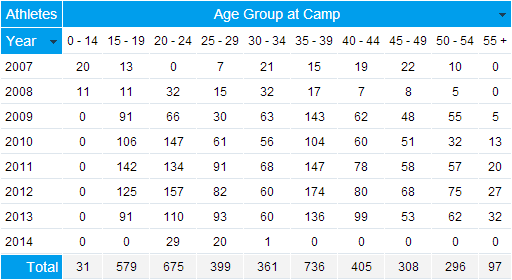
To add summaries to your cross tab you can either use the table field drop down menu or main menu summary option. This option is located on the main menu and not on the individual columns as with a column report.
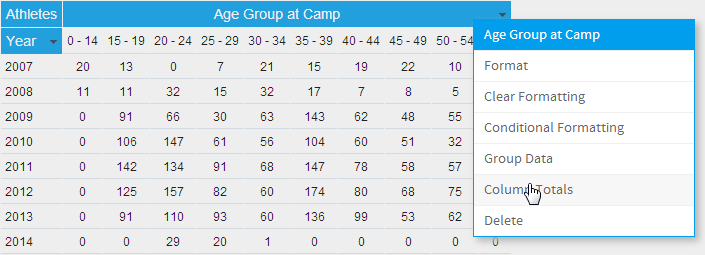
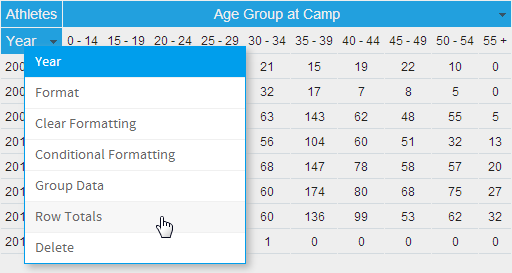
From the main menu you can choose to apply either column or row totals. You can select both the row and the column totals. This creates totals at the right hand side of the report and at the bottom of the report.
Cross Tab Sub Totals
| Styleclass | ||
|---|---|---|
| ||
When creating a cross tab report you can also include sub totals on your report if you have more than one dimension defined as a row entity.
- To create a cross tab subtotal use the main format menu to select the column that the sub total is to be applied to.
- Choose the summary drop down and choose 'Subtotal'
Section Summaries & Grand Totals
| Styleclass | ||
|---|---|---|
| ||
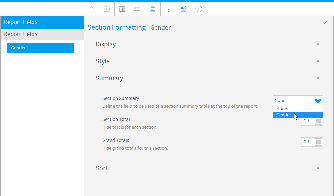
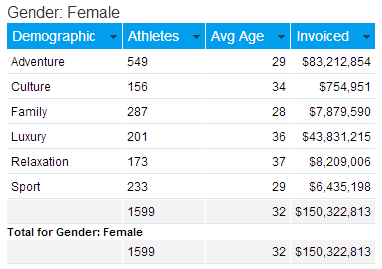
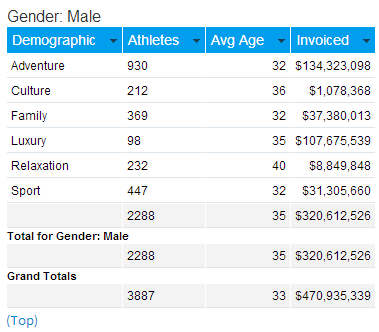
Section totals can be applied to any numeric value. When a section is added to the report an option to have the totals displayed for all numeric values is available.
- To activate this option select the section format options from the main menu.
- Choose the section you wish totals to be applied to and click the summary drop down option:
...
Option
...
Description
...
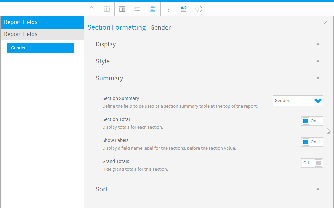
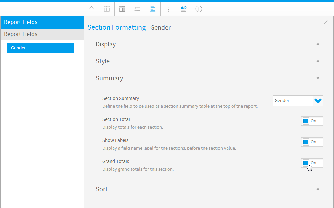
Section Summary
...
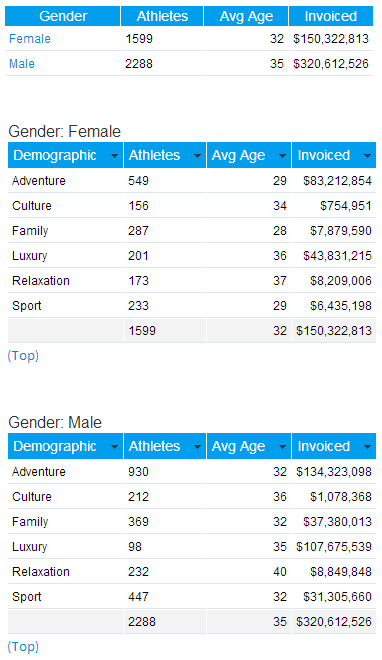
The section summary is a unique method of adding in a table of contents into your report. This will create a one line summary of all sections in your report at the top of your report with hyper links to the details sections - even if you have page breaks.
Choose the section that you wish to apply the section summary for using the drop down available.
...
Section Total
...
If you wish a section total to be applied the check the tick box.
Note: Totals will only be displayed for columns that you have already applied totals to.
...
Grand Total
...
合計では、詳細なレポートの一部として概要レベルのデータをユーザーに提供するために集計の合計が作成されます。複数のタイプの合計を表に組み込むことができます:
- フィールド合計
- カテゴリー別小計
- セクション合計
- セクションサマリー表
- 総合計
作成する合計のタイプに応じて、以下のタイプを選択してアクセスできます:
 合計:フィールド内のすべての値を加算して合計を出します。
 平均:フィールド内のすべての値の平均値を求めて、合計を出します。
 個数:フィールド内の値の数をカウントして合計を出します。
 重複を除いたデータの個数:フィールド内の一意の値の数をカウントして合計を出します。
 合計(計算フィールド):フィールドが計算である場合にのみ使用可能で、計算を使用して合計を出します。
標準的な表のサマリー
| Styleclass | ||
|---|---|---|
| ||
合計の集約
| Expand | ||
|---|---|---|
| ||
カラムまたはロウベースの標準的な表でフィールドに合計を追加するには、以下の2つの方法があります: フィールドのドロップダウン
「カラム(列)の書式」メニュー
|

ラベルの表示
| Expand | ||
|---|---|---|
| ||
|
スタイル
| Expand | ||
|---|---|---|
| ||
|
小計
| Expand | ||
|---|---|---|
| ||
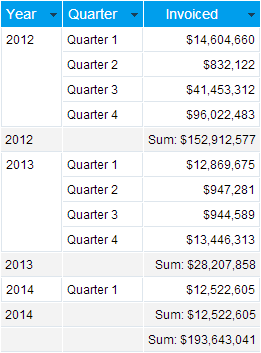
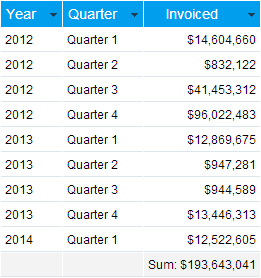
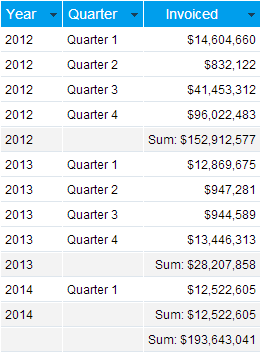
小計は、表内に複数のディメンション(次元)フィールドがあるために、カテゴリーごとに複数のレコードが存在する場合に使用されます。小計は、カテゴリー値ごとの合計値を表示する場合に役立ちます。ここに示す例では、「Quarter」フィールドがあるために、年の値ごとに複数のロウ(行)が存在することから、「Year」の小計を使用できます。
通常、小計を使用する場合は、レポート表示を活用しやすいようにこの機能と「重複表示の排除」オプションを組み合わせます。このオプションを適用するには、以下の手順を実行します:
|
セクションサマリー
| Styleclass | ||
|---|---|---|
| ||
セクションサマリー
| Expand | ||
|---|---|---|
| ||
|
セクション合計&ラベル
| Expand | ||
|---|---|---|
| ||
|
総合計
| Expand | ||
|---|---|---|
| ||
|
クロス集計の合計
| Styleclass | ||
|---|---|---|
| ||
カラム(列)の合計
| Expand | ||
|---|---|---|
| ||
|
ロウ(行)の合計

| Expand | ||
|---|---|---|
| ||
|
| horizontalrule |
|---|
| Styleclass | ||
|---|---|---|
| ||