Overview
The Column format tab contains a number of sections that you can use to format the individual columns contained on a report. Each of these sections is described in detail below.
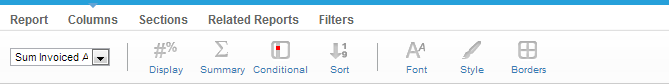
Column Selection
If you have navigated to the column format tab using the tab selection process you will have to choose the column that you wish to edit. Choose the appropriate column from the drop down menu.
Data Format
The data format section allows you to change the styles that will be applied to the data contained in column.
Display
The display options are used to change the data format of the column such as the number of decimal places and the prefix or suffix to be applied.
Option |
Description |
||||||||||||||||||||||||||||||||
|---|---|---|---|---|---|---|---|---|---|---|---|---|---|---|---|---|---|---|---|---|---|---|---|---|---|---|---|---|---|---|---|---|---|
Display Name |
To change the display name of the column from the default value simply update this field. |
||||||||||||||||||||||||||||||||
Format |
Each data type will have a unique set of format options - eg Text, Date or Numeric. The option details are listed below. |
||||||||||||||||||||||||||||||||
Sub Format |
Depending on the format option you have chosen for the column above you will have a separate set of sub format options. Select the appropriate sub format option. |
||||||||||||||||||||||||||||||||
Date Other |
If you select 'Other' from the date sub format you will be able to build your own custom date format. |
||||||||||||||||||||||||||||||||
Decimal Places |
If you have a defined a numeric format you can set the number of decimal places to be defined. This can be used to define cents in a decimal place for $20.00 by adding in:2
|
||||||||||||||||||||||||||||||||
Prefix |
The prefix is used to include additional characters before the value that is returned from the data base. This can be used to define currency for $20.00 by adding in: $ |
||||||||||||||||||||||||||||||||
Suffix |
The suffix is used to include additional characters after the value that is returned from the data base. This can be used to define percentage for 30% by adding in: % |
||||||||||||||||||||||||||||||||
Rounding |
The rounding format allows you to choose how a decimal value should be rounded.
|
||||||||||||||||||||||||||||||||
Thousand Separator |
Turns the defaulted thousand separator for your instance on or off. For example: |
||||||||||||||||||||||||||||||||
Show Field |
To hide the column from the report, select this item. By hiding a column the data presented on the page is not re-grouped which would occur if you removed the field from your report. For Example: Original Report
City Column Hidden
City Column Removed From Report
|
||||||||||||||||||||||||||||||||
Suppress Duplicates |
The suppression of duplicate option will remove duplicate values from a column and group the values under a single value. |
Display Formats
Based on the type of field that the column being formatted is there are various format options. The ones listed below come default with Yellowfin, however as this is customisable there may be additional ones that comes as part of your installation.
Format Options |
Description |
|---|---|
Text |
Displays as plain text |
Case Formatter |
Allows you to format text as Uppercase or Lowercase. |
Creates a hyperlink on the text that will open an email client and pre-populate the sent to address. |
|
Flag Formatter |
If your data contains ISO country codes you can display these as flags of the world instead of text. |
HTML |
Formats a field containing HTML tags, either by removing them, or using them, depending on user selection. For example, if you wanted to display an image using a URL the field may look something like this: |
HTML 5 Video |
Displays a video from a path stored in the field, either a full URL, or a relative path if the video is stored in the Yellowfin ROOT directory. |
Link To URL |
Allows you to pass the value of the returned data into a URL link. This essentially means that every ip address will be placed into it into it i.e.: http://www.google.com.au/search?hl=en&q=10.100.32.44 |
Org Ref Code |
Converts the text in the cell to the value of an internal lookup table. E.g. AU to Australia. See Org Ref Codes for more information. |
Raw Formatter |
Displayed the data as it would have been returned from the database - no additional formatting applied. |
URL Hyperlink |
Creates a hyperlink on the text and will open web page on click. Assumes the text is a legitimate URL. |
YouTube Formatter |
This displays a YouTube video, based on the ID being stored in the field. |
|
Date |
Date |
Displays value as a date - multiple date options exist. |
Time |
Displays value as a time field - multiple date options exist. |
Timestamp |
Displayed full date and time value |
Date Part Formatter |
Takes a date field and formats the display to show part of that date. |
|
Numeric |
Numeric |
Displays value as a decimal - allows you to set the decimal places to be used. |
Percentage Bar |
Converts a percentage value less than or equal to 100 into a bar. |
Summary
To apply summaries or totals to your data use the summary drop down option.
Option |
Description |
|---|---|
Summarise |
If you wish to add totals to your columns then select the type of summary you wish to apply. (None, Sum, Average, Count, Calculated Total) |
Label Summaries |
If you wish to include a label on the summary to let the user know what sort of summary has been applied. For example |
Sub Totals |
If you wish to apply a sub total for a column then tick the sub total option. Sub totals will be applied for each unique value - and will be shown for each column on which totals have been applied. |
Style |
To format the style of the total use the style settings to change the font and colour etc. |
Conditional
The conditional format options allow you to add format rules which will change the style of the values based upon the rules you apply. For example if revenue is less than 10000 then show cell in RED.
See Conditional Formatting for more information.
Column Style
The options in this section are used to apply formatting styles to the selected column.
Font
If you wish to set the font format to something other than the default settings use these options to do so.
Style
The Column style setting allows you to change the non font related setting of the column display.
Option |
Description |
|---|---|
Alignment |
Align your data left or right |
Background |
Change the background colour of the column. |
Column Width |
Generally the column width is dynamic. It will grow or shrink to fit the data returned from the data base. |
Max Length |
If you wish to display a set number of characters use this setting. Data that is longer than this will be truncated to fit the max number of characters |
Wrap Text |
If you do not wish to have long text fields wrapped turn off the wrap text option. |
Borders
If you wish to apply a border around your table as well as the settings for that table you can use the border drop down to do so.
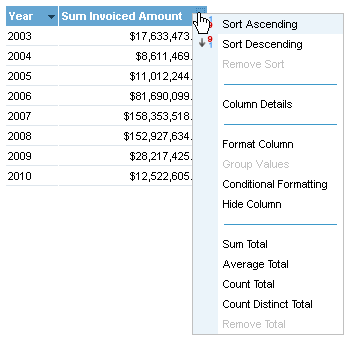
Column Drop Down Menu
If you wish to select a column to format from the table you can do so by clicking the menu drop down in the column title.
Option |
Description |
|---|---|
Sort Ascending |
Sort the data in ascending order - A to Z or 1 to 9. |
Sort Descending |
Sort the data in ascending order - Z to A or 9 to 1. |
Remove Sort |
If a sort is applied to a column you can remove it by selecting this option. |
Format Columns |
To open the format popup for this specific column and choose multiple format options choose this item. |
Group Values |
To group variables in a column - e.g. age (1-18 = Youth, 19-36 = Gen Y etc) choose this menu item. |
Conditional Format |
To apply rule based formats to a column e.g. if revenue is less than 10000 then show cell in RED, select this menu item. |
Hide Column |
To hide the column from the report select this item. By hiding a column the data presented on the page is not re-grouped which would occur if you removed the field from your report. See the Column menu for details of how this is displayed. |
Sum Total |
Inserts a summary summed total at the bottom of the column for all the values in the column. |
Average Total |
Inserts an average for all the values displayed in the column. |
Count Total |
Inserts a count of all rows at the bottom of the column - this total can be applied to dimensions as well as metrics. |
Count Distinct Total |
Inserts a count of all unique rows at the bottom of the column - this total can be applied to dimensions as well as metrics. |
Calculated Total |
The calculated total is only available for calculated fields and will create a total based on the same rules as were used for the calculation. For example if you have a ratio of Received / Invoiced the total will equal the Sum (Received) / Sum (Invoiced) |
Remove Total |
Removes any summaries if they have been included for the column. |
Column Drag and Drop Options
Most of the formatting options available to you are accessed through the report and chart format menu. However, once your report has been generated you can use some drag and drop formatting options to change the layout of your report.
The drag and drop formatting are only available whilst a report is in DRAFT mode. If the report is ACTIVE you will not see these options.
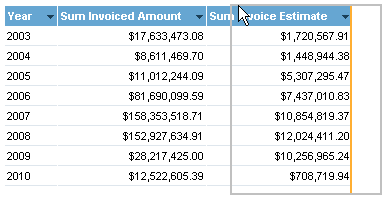
Column Order
You can change the order of your columns directly on the screen. This option is only available for 'column' based reports.
- To move a column, place your cursor over the column title and when the cursor changes into a cross icon click and hold.
- Now drag your column into the desired location. You will see the outline of the column and a highlighted line which indicated where the left hand border of the column will be placed.
- Drop your column and the page will be refreshed with your column in the new location.
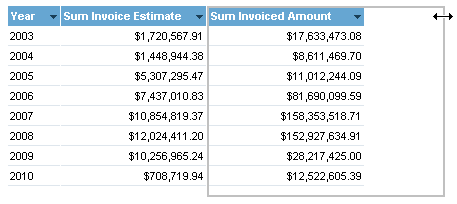
Column Resizing
You can resize a column as seen on a report by placing you cursor over the right hand column border of the column you wish to resize.
- Click and hold the cursor. The cursor will be represented as a horizontal line and the column outline will be highlighted.
- Drag your column to the desired width and let the cursor go. The report will refresh and your column will be resized.