Overview
The Report Data page is where you build, edit and view the report data definitions used to generate Yellowfin reports. These definitions include both the queries you use to retrieve data for your document, and the data formatting.
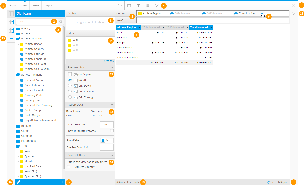
# |
Option |
Description |
|---|---|---|
1 |
Navigation |
Access various builder steps by clicking on the links in the navigation bar. The Report link provides the user with save options throughout the building process, rather than waiting until the final step. |
2 |
View Fields Search |
Search for fields to use in the report here, accessing all fields provided by the selected View in the previous Create step of the builder. |
3 |
View Fields List |
Select fields to use in the report from the list provided by the selected View in the previous Create step of the builder. To add multiple fields at once, simply hold down Ctrl/Command or Shift while selecting fields. |
4 |
Formatting Menus |
Access various formatting menus from this section of the navigation bar. This allows the user to apply formatting changes to the report and preview the output while still on the Data step, rather than having to toggle between it and the Output step. |
5 |
Table Body Fields |
Drag fields into the Columns and/or Rows lists to build the body of the report. Adding fields to both lists will create a cross tab report automatically. |
6 |
Field Drop Down Menus |
Apply aggregations, formatting, advanced functions, totals, and other options to a field via its drop down menu. |
7 |
Table Preview |
View a preview of the final report output. The user can also drag fields into this preview area, rather than adding them to the Columns or Rows list to add them to the table. Fields can also be reordered here by dragging the field headers into position. |
8 |
Section Fields |
Select fields to be used as sections in the report, these will create splits in the table for each value of the section field(s). |
9 |
Filter Fields |
Select fields to be used as filters in the report, values for these can either be defined during the report creation process, or left as user prompt. |
10 |
Close Builder Button |
Leave the builder using this button. |
11 |
Filter Panel |
Apply values to filters defined as user prompt here in order to restrict the results in the table preview. Values applied here are only used to adjust the preview, not the final report output. |
12 |
Analysis Style |
Enable Related Reports and Drill functionality through this panel. |
13 |
Report Data |
View the Data Source and View name that the report is built on. The user can also limit the rows returned in the report, the preview, and switch the Auto Refresh off if they wish to build with dummy data, rather than continually querying the database after each field change. |
14 |
Source Filters |
If there are source filters applied to the View selected to build off, they will appear here to be enabled/disabled. If the user does not have the Access Filter role permission they will not see this section. |
15 |
Sub Query Panel |
Create and switch between sub queries through this panel. If the user does not have the Sub Queries role permission they will not see these buttons. |
16 |
Edit View |
The user can access the view via this button in order to make changes required for the report creation. If the user does not have the appropriate Database Views role permissions they will not have access to this button. |
17 |
Add Calculation |
The user can create calculated fields to use within the report. Depending on the user's role permissions they may be able to create Freehand SQL calculations as well as using the builder interface. |
18 |
Table Preview Info |
View the number of rows and time taken to return the table preview. |
19 |
Refresh Report |
Refresh the data displayed in the table preview. |
Adding Fields
To include a field in your table simply drag the field from the View Fields List, on the left of the page, to the Columns and/or Rows lists.
- Locate the field(s) you wish to use either by;
- Keyword Search at the top of the View Fields List
- Opening the field category(s) they are located in
- Select the field by clicking on it. If you have multiple fields to add hold down the Ctrl/Command or Shift keys while selecting the fields.
- Drag the field(s) into the desired Column or Row list (see Layout Options below for more information on where to place your fields) or directly into the preview panel.
- You will now see a preview of the table. Continue adding fields as required.
Field Types
Icon |
Type |
Description |
|---|---|---|
Dimension |
These are typically text or date fields and are used to describe the data. |
|
Metric |
These are the numeric values to be measured in the report. For example, sales sum, customer count, event count, average age. |
|
Pre-Defined Filter |
These are fields defined in the view to be used as filters in the report with pre-defined values attached, saving the user time defining the same filters over multiple reports. |
|
Filter Group |
These are like the pre-defined filters above, but are sets of filters, some of which may be set to user prompt rather than having set values. |
|
Parameter |
These are fields used to capture a value from the user which is then passed through to calculated fields or filters in the report. |
Layout Options
There are three types of table layout available:
Layout |
Description |
|---|---|
Column |
The most common form of table output, all fields added are displayed as a column in the table layout, with the field name used as the column header. |
Row |
A variant the column layout, all fields added are displayed as a row in the table layout, with the field name used as the row header. |
Cross Tab |
A special layout that allows you to summarise data by using both Column and Row headers with Metric fields making up the body of the table. This display is sometimes referred to as a Pivot. |
See Table Layouts for more information.
Data Validation
Data validation checks are made by Yellowfin to ensure you are building your report the way in which the administrator intended. You will be prompted if you have used fields and filters incorrectly with the following messages:
Mandatory
The fields shown in this type of message must be included into the field or filter section of the report. For example:
A variation of the mandatory field section validation is when a selected field in the table is being aggregated by sum or average. Constraints can be set when this occurs so that meaningful data is presented in the report. The validation message will look like this:
To proceed with your report you can remove the sum or average aggregation on the selected field or drag the relevant fields indicated in the validation message into the report.
Excluded
The fields shown in this type of message must not be included into the field or filter section of the report when a selected field in the table is being aggregated by sum or average. Constraints can be set when this occurs so that meaningful data is presented in the report. The validation message will look like this:
To proceed with your report you can remove the sum or average aggregation on the selected field or remove the relevant fields indicated in the validation message out of the report.
Suggested
When a suggested field or filter occurs, a messages box will appear with the suggestion. The user can chose to include this field or filter into the report or to ignore the suggestion.
In list
When constraints are set up on a report, one of the options is to select a few fields from a table and set the constraint as one in list. This means that at least one of the selected fields must be included in the report. When this validation message is displayed it will show the list of all the fields where at least one must be included in the report. To fulfil this constraint simple make sure one of these fields are included in the report.
Removing Fields
There are two ways to remove a field from your table:
- Select the field in the Columns/Rows list it's placed in, open the drop down menu and select Delete
- Select the field in the Columns/Rows list it's placed in, and drag it to an area of the page that cannot contain a field (as pictured)
Reordering Fields
There are two ways to reorder fields in your table:
- Select the field in the Columns/Rows list it's placed in, and drag it to its new position
- Select the field header in the Table Preview area, and drag it to its new position