Overview
There are three types of table layout available:
Layout |
Description |
|---|---|
Column |
The most common form of table output, all fields added are displayed as a column in the table layout, with the field name used as the column header. |
Row |
A variant the column layout, all fields added are displayed as a row in the table layout, with the field name used as the row header. |
Cross Tab |
A special layout that allows you to summarise data by using both Column and Row headers with Metric fields making up the body of the table. This display is sometimes referred to as a Pivot. |
Column Based Tables
Yellowfin tables display data in either rows or in columns and have a header and footer. Header and footer rows and columns are special rows and columns. The header displays information about the row or column e.g. a label or the name of the variable whose values are displayed. The footer displays calculations on the values displayed in the columns or rows.
You can display the variable labels along the top row of the table so that you read the data down the columns as shown below:
When to Use Column Based Tables
A column table is a sequential, two-dimensional list. This doesn't imply that the data in a table is simple or uncomplicated: you can present a great deal of data in a table. The layout of columns within a table is directly related to the layout of the items within the columns data list. Yellowfin places the cells in the table in the same order in which they appear in the report columns list.
Suitable for - Presenting data in a tabular, two dimensional list.
Keep in mind:
- Arrange the items in the order you want them to appear in the column list. For example, if you want each row to have a location, headcount and basic pay, in that order, arrange the data items in that order in the Dimensions Edit Field.
- Whether your document includes sections or not, you always lay out the body of the table in the Column Edit Field.
Row Based Tables
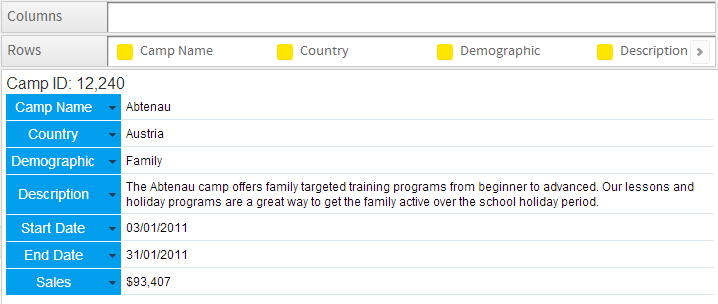
Row based tables allow you to have the variable labels displayed down the left edge of the table so that you read the data across the rows as shown below. This table format is typically used in financial reports or where the value of a field needs to be highlighted. For example if the reader of the report were to focus on location then this type of report allows them to easily view the data related to Sydney.
When to Use Row Based Tables
A Row table is similar to a Column table, but the header and information are displayed vertically, instead of horizontally. When you set the report type to Row, the Row Edit Field looks identical to the Dimensions Edit Field. However, when the report is run the data will be displayed in rows rather than columns.
Suitable for - Presenting data in a vertical format.
Keep in mind:
- Arrange the items in the order you want them to appear in the Row Edit field.
- Whether your document includes section or not, you lay out the body of the table in the Row Edit field.
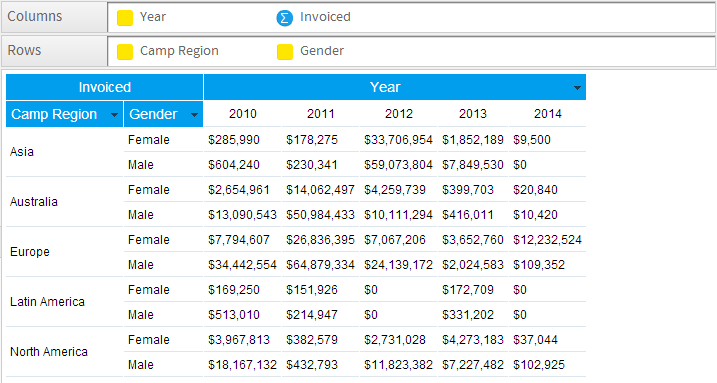
Cross Tab Tables
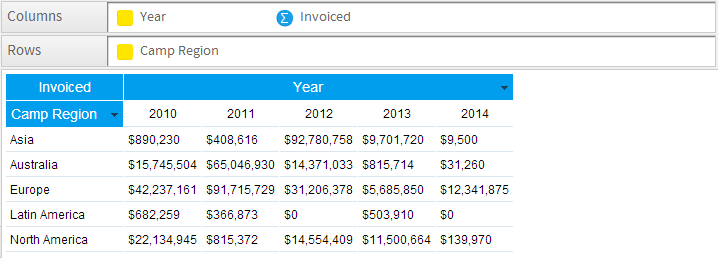
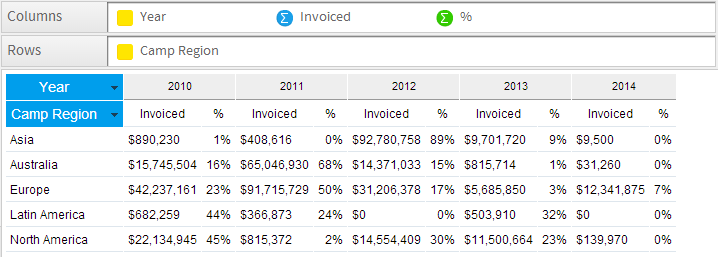
You can create a cross tab report to present data more clearly. A cross tab report shows a summary value at the intersection of each row and column. Create a cross tab report by rotating the values in a list report to product column headers. You can cross tab on more than one non-measure column to create a nested cross tab. For example, add cities underneath the Country column headers at the top of the report. Adding this report item will further subdivide sales by individual cities in each country.
The example below displays the total number of products sold in each country, broken down by product line. The values at the intersection points of rows and columns show summarized information.
Keep in mind:
- Arrange the items in the order you want them to appear in the row and column fields.
- Whether your document contains sections or not, you lay out the body of the table in the row and column dimension item fields.
- Metric items cannot be used in the vertical or horizontal headers; they can only be used in the body of the cross tab table.
- You can add more than one item in the body of the cross tab table.
- You can use more than one item in the vertical or horizontal headers.
Setting up Cross Tab Tables
Basic Cross Tab
A basic cross tab table will have only one row dimension, one column dimension and one measure specified.
- Open the report data page and select the Cross tab Table option in the report options menu. This will enable the row and column fields. The page will be refreshed and you will see the addition of two additional fields input boxes.

- Drag the dimensions and metrics that you wish to display in your cross tab table. You must have at least one dimension in each of the row and dimension fields and at least one metric specified for the cross tab table to function.
- Click Preview once you are happy with the data defined for your cross tab report. This will create a report and display you data in a rows and columns intersect method.
Advanced Cross Tabs
To create more advanced cross tab tables you can add additional metrics or dimensions to your report data. However, consideration needs to be taken into account of the complexity of the data output that is being created.
Two or More Measures in the Cross Tab
To include more than 1 metric in your cross tab table drag an additional measure into the metrics box.
Note: the order of your measures as displayed in the output will reflect the order of measures as displayed in the measures edit box.
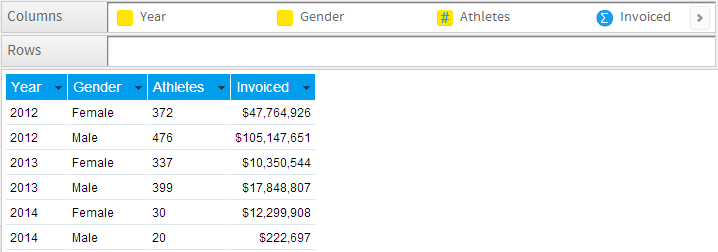
In this example Count Athlete ID and Sum Invoiced Amount Rating are included.
- There are now two measures displayed in the report. They span the column heading. E.g. Each value of Year has two corresponding measures
- The measure title has moved into the report body as well.
Two or More Dimensions
To include more than one Row or Column Dimension onto your report drag an additional dimension into the row or column fields edit box.
In the example above Age Group at Camp and Gender have been used as columns..
Note: the order of your data items in the row dimensions edit box will determine the output order of the data.
- Two column dimensions are now displayed. The Age Group at Camp dimension spans the Gender dimension. This breaks up Gender by Age Group at Camp.
- As many dimensions as required can be added to a report.