Yellowfin Overview
Yellowfin is designed to reuse components, such as Source Connections and Views, as much as possible. This model creates a hierarchy of objects within Yellowfin and understanding this hierarchy will assist you with this tutorial.
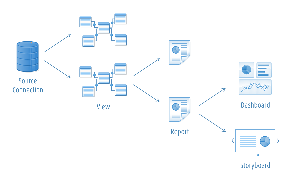
Source Connections |
A source connection stores details of how Yellowfin will connect to an external database that you wish to report from. For every database that you wish to write reports for, you will have to create a single source connection record within Yellowfin. |
|---|---|
Views |
Once you have defined a source connection you must create one or more view records that your users can report off. |
Reports |
Once a view is defined you can write a report against it. A report record is a report definition which defines which columns in your database you want to display and how you want to display them. |
Dashboard Tabs |
Once you have written reports, you can begin to construct your dashboard. You can place as many reports onto a tab as you wish. You can also create as many tabs as you wish on your own personal dashboard. |
Storyboard |
Storyboard is a presentation layer in Yellowfin that allows users to create slide shows with fully functional reports as well as text, images, and videos. |
In this tutorial we will work sequentially through this hierarchy. First we will understand how connections to the database function, then create a view and then write reports before finally adding these reports to a new dashboard tab.
Ski Team Tutorial Database
The tutorial database used for this tutorial is the Ski Team database. This database is part of the Tutorial Content that you will need to choose to install along with Yellowfin. The data has been structured to provide a similar experience to that you may have had when reporting from many operational databases.
About Ski Team Database
Ski Team is a ski tourism business that organises ski trips in various locations around the world and markets these to its existing clients. The Ski Team database contains information relating to the core tourism business. It contains details of the camps run, the athletes who attended those camps, and campaigns associated with sourcing athletes. In addition it does contain financial information related to the amount invoiced and received for each client taking part in ski trips.
The data in this database will assist managers of Ski Team to understand the profitability of each of their programs, identify who their most profitable clients are and better manage their best performing camps.
Ski Team Tables used in this Tutorial
For the examples in this tutorial only four tables from the Ski Team database are used. These are:
Athlete Fact |
This contains information about each athlete and their participation on a camp. In this database the person fact will generally have one record for each camp and each person for every year. The fact record is concerned about the individual trips for each program. |
Camp |
This is a dimensional table which contains information about each camp. For example the name and location of the camp. Camp ID is the Key to this table. |
Person |
The person table contains information about the athlete such as name and address details. Person ID is the Key to this table. |
Date Lookup |
This table is used to create data hierarchies used for drill down purposes. Day Date is the Key to this table. |
In this tutorial we will use these tables to construct a view which centered on the customer. It will let us report the revenue generated by customer and overall performance of our ski programs.
About this Tutorial
This tutorial is made up of 5 steps:
Step |
Description |
Learn how to... |
|---|---|---|
1 |
|
|
2 |
|
|
3 |
|
|
4 |
|
|
5 |
|