概要
レポートビルダーの「ドラッグ&ドロップビルダー」は、単純な分析レポートと複雑な分析レポートの両方の作成に役立ちます。ビルダーで使用可能なステップは、ユーザーがこれまでに選択した、以下のような一部のオプションによって異なります。- 使用するビルダーの種類
- 作成時のベースとなるデータソース
- レポートで使用するフィールドおよびフィールドで定義されたレイアウト
- レポートに追加したフィルターまたはセクション(あるいはその両方)
- 関連レポート、ドリル機能、およびサブクエリーの追加
<iframe width="700" height="394" src="https://www.youtube.com/embed/7Wt6ikMvRVA?color=white" frameborder="0" allowfullscreen></iframe>
Report Builder Steps
Included in the report builder are a number of possible steps:作成
The first step in building any report is selecting the type of report you wish to run and the data source required. Your organisation may have many views and data sources so selecting the correct one is critical prior to building your report.
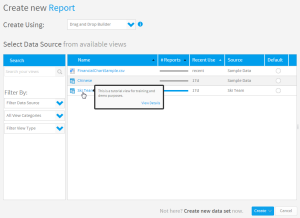
See Initialise Report for more information.
Data
The report data section allows you to define the look and feel of your report, including the fields to be displayed, the filters to be used, and whether a chart or drill through should be displayed. Select the items from the view that you wish to include in your report and drag them into the appropriate section of the screen.
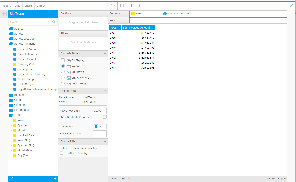
Note: depending on the builder you select, this option may be replaced with alternatives such as; CSV, SQL, Jasper, and BIRT.
See Report Data for more information.
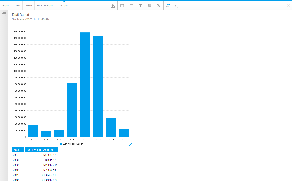
Charts
The Charts page allows you to build visualisations based on the table created in the Data step.
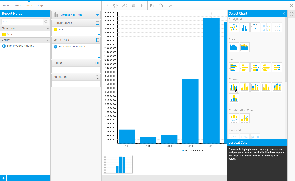
See Charts for more information.
Related Reports
Create relationships between the draft report and other content using Drill Through and Co-Display reports.
See Related Reports for more information.
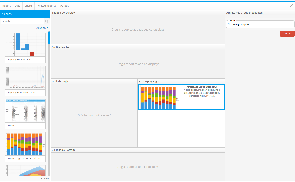
表示
The Output page allows you to format the report, set up a multi-chart canvas, and other functions.
See Output for more information.