Page History
...
Yellowfin is an easy-to-use report writer for non-technical users, delivering drag-and-drop simplicity for formatting and data selection. With Yellowfin, you can access information from multiple data bases without special coding knowledge. This is easy because you work with data in business terms that are familiar to you without the need to understand complex technology principles.
Where does the data come from?
| Styleclass | ||
|---|---|---|
| ||
Yellowfin makes it easy connects to access data for your reports because it uses what is called a meta-data layer that hides the technical issues of the underlying database. Generally you do not need to know much about the meta-data layer, only that it is there and is referred to as a View (since it provides you with a view of your data).
The View is created by your Yellowfin Administrator and maps to data in your database, using everyday business terms. This makes it easy to select the data you want for your report through user-friendly drag and drop interface. You will learn more about the report writer later.
Views consist of categories and items. The categories are logical groupings of items. For example in a human resource view the category of PERSONAL DETAILS could consist of items including last name, date of birth and gender.
When you build a report, you select items from a view, and then run a query. Yellowfin connects to the database, and retrieves the data mapped by the items you selected.
What about security?
| Styleclass | ||
|---|---|---|
| ||
Yellowfin is very secure. Your administrator has many options for managing security profiles. All of the rights you have as a user are granted by your administrator. The administrator defines:
- The parts of the Yellowfin interface you can access. Your administrator can restrict the availability of Yellowfin functionality, such as access to certain menu commands;
- The Categories and Subcategories of reports that you can access;
- The views you can access for creating and editing queries;
- Your ability to publish public reports; and
- The data that you can access
The permissions assigned to each user define the content they can see and the functionality they can access. This profile-based security system allows a single report to be distributed to many users - with end users having access only to the information that they are authorised to see.
...
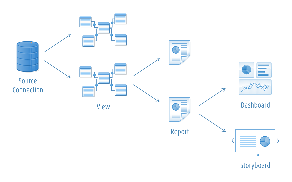
your data through a Source Connection which is set up by an Administrator. From here, Advanced Users design and create Views which are meta-data layers used to specify relationships in the database and field availablitiy.
Views provide the Report Writer with fields to build their reports, without the need to understand all the technical aspects of database relationships. The Report Writer is then free to build content through the drag and drop interface.
When a user runs a Report, it uses logic defined in the View, and connects to a database via the Source Connection in order to return results.
What can my reports do?
| Styleclass | ||
|---|---|---|
| ||
Using Yellowfin you , a Report Writer can create many different types of reports to suit your reporting needs. These can vary from basic tabular reports to far more advanced varieties., charts, and KPIs, to advanced geographical maps and reports that can combine results from multiple sources.
Some of the functionality available in reports includes:
- Drill - reports can move from a high level overview of data down to transaction level detail based on user interaction.
- Alerts - reports can contain highlighting based on rules defined by a Report Writer in order to draw the user's attention to a value.
- Calculations - reports can contain basic to highly complex calculations which can be defined in the View or Report.
- Filters - reports can restrict results returned through the use of filters either defined by the Report Writer or the Report Reader.
- Charts - reports can contain a wide range of visualisations defined through the Report Builder which allow users to view data outside of a tabular format.
- KPI & Summary - reports can contain KPI or Summary displays which allow users to quickly assess values important to them, before exploring in further detail.
- With Yellowfin you may be able to create and distribute reports that are "drillable." This means that other users can simply click on values in the report to see more detail as they feel they need it, without having to run the query all over again.

- You can set up a report to include calculations and Conditional Formats.

- You can include prompts that let you obtain just the information you need, and filter out the rest.

- You can choose from a wide variety of chart formats to represent the data. If you think another graphical format would make the data clearer, you can change the format in a couple of mouse clicks:

| horizontalrule |
|---|
...