changes.mady.by.user Yellowfin Admin
Saved on Jul 02, 2015
...
top
Optionオプション
Description説明
Style
Specify the shading style for the series.
Direction
Select the direction of the gradient shading to be applied to the series.
Colour
Define the colour(s) to be applied to the series.
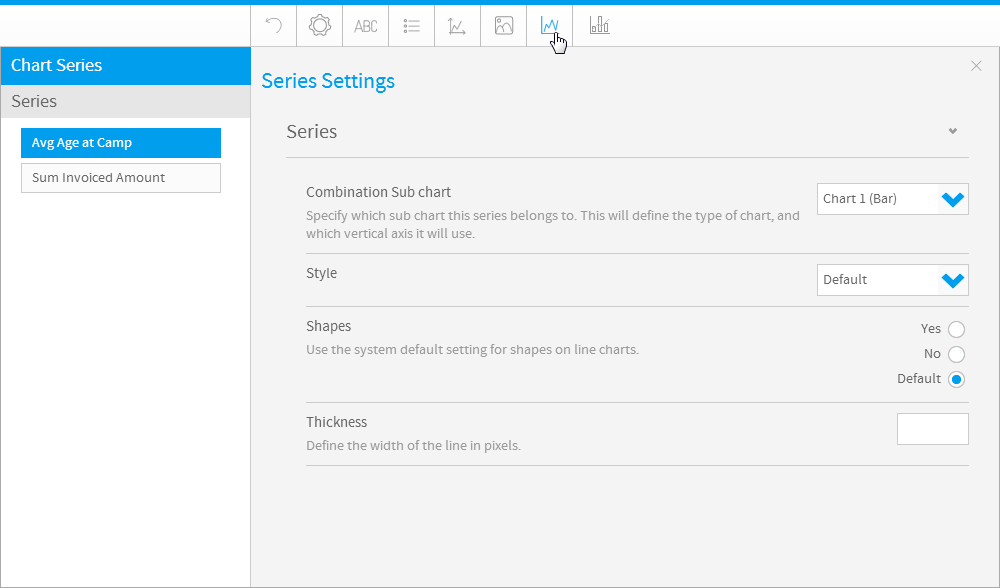
Combination Sub Chart
Specify which sub chart this series belongs to. This will define the type of chart, and which vertical axis it will use.
Shapes
Define whether line shapes are on, off, or system default.
スタイル
シリーズの陰影スタイルを指定します。
方向
シリーズに適用するグラデーション陰影の方向を選択します。
色
シリーズに適用する色を定義します。
コンビネーションサブグラフ
このシリーズが属するサブグラフを指定します。これにより、グラフのタイプ、およびグラフで使用する縦軸が定義されます。
形状
線の形状が有効、無効、システムデフォルトのいずれかを定義します。
幅
線の幅をピクセル単位で定義します。
Thickness
Define the width of the line in pixels.
Define a colour for the outline of the series.
シリーズのアウトラインの色を定義します。
シリーズのアウトラインの幅を定義します。
Width
Define the width of the outline of the series.
シリーズに適用する色セットと境界を定義します。
Define the colour set and bounds to be applied to the series.
{html}<iframe width="700" height="394" src="https://www.youtube.com/embed/-p_zIxz0_vg?color=white" frameborder="0" allowfullscreen></iframe>{html}
スピード
各フレームの表示時間を定義します。
Speed
Define how long each frame is displayed for.
Display表示
Enable/Disable the display of conditional formatting alerts on the chart.
Select how to display the alerts on the chart from three styles:
グラフでの条件付き書式アラートの表示を有効化/無効化します。
グラフでのアラートの表示方法を、以下の3つのスタイルから選択します。
位置
グラフの前景(前面)と背景(背面)のどちらにアラートを表示するかを定義します。
Position
Define whether the alert should be displayed in the foreground (in front) of the chart, or in the background (behind) the chart.
{html}<iframe width="700" height="394" src="https://www.youtube.com/embed/YWCKaHNIOWU?color=white" frameborder="0" allowfullscreen></iframe>{html}
topページトップ
Option
Description
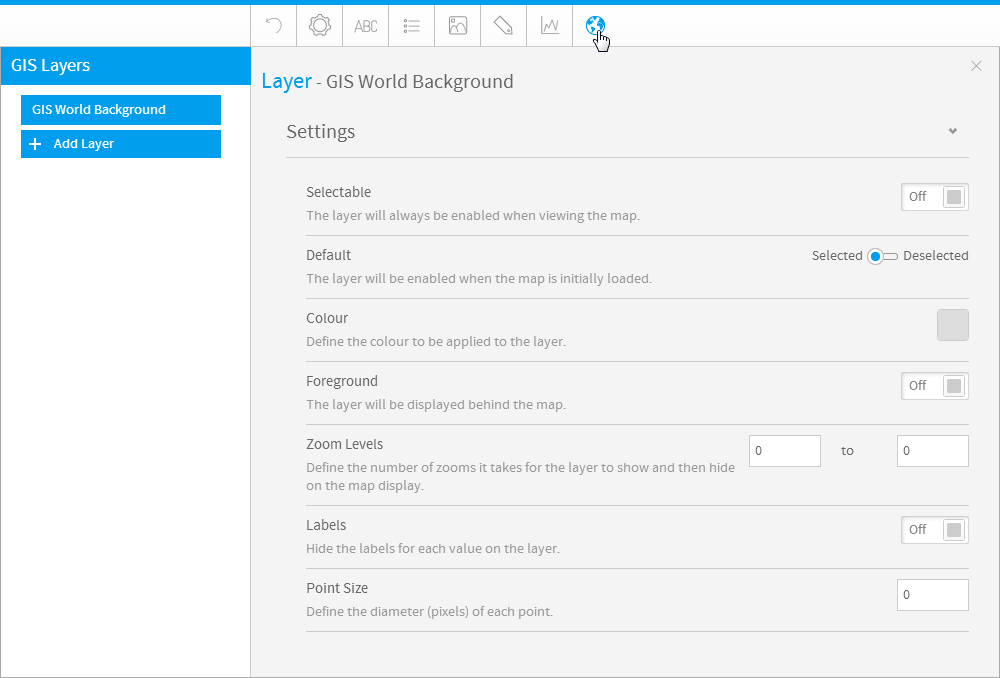
Selectable
Allow the user to enable and disable the layer when viewing the map.
Default
The layer will be enabled when the map is initially loaded.
Define the colour to be applied to the layer.
Foreground
The layer will be displayed in front of the map.
Zoom Levels
Define the number of zooms it takes for the layer to show and then hide on the map display.
Labels
Display the labels for each value in the layer.
Point Size
Define the diameter (pixels) of each point.
Bubble Fill Type
Define the shading effect to be applied to the bubbles.