Page History
...
| Table of Contents | ||
|---|---|---|
|
...
概要
| Styleclass | ||
|---|---|---|
| ||
| Wiki Markup |
|---|
{html}<iframe width="700" height="394" src="https://www.youtube.com/embed/XW1i61lxiME?color=white" frameborder="0" allowfullscreen></iframe>{html} |
...
含める
| Styleclass | ||
|---|---|---|
| ||
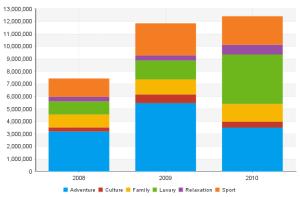
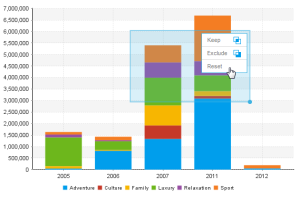
- Click and drag to highlight an area on the chart
- Select the Keep option
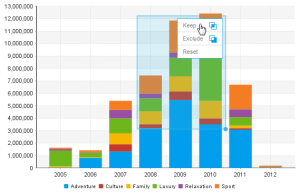
- You will now notice that the chart has been restricted to only the values you selected in the highlighted range
...
- クリックしてドラッグし、グラフの領域を強調表示します。
- 「キープ」オプションを選択します。
- グラフが強調表示した範囲で選択した値にのみ制限されます。
含めない
| Styleclass | ||
|---|---|---|
| ||
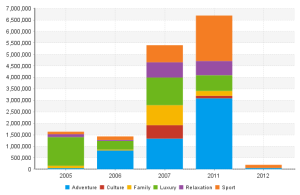
- Click and drag to highlight an area on the chart
- Select the Exclude option
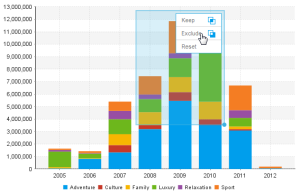
- You will now notice that the chart has removed the values you selected in the highlighted range
...
- クリックしてドラッグし、グラフの領域を強調表示します。
- 「含めない」オプションを選択します。
- グラフから強調表示した範囲で選択した値が排除されます。
リセット
| Styleclass | ||
|---|---|---|
| ||
- Click and drag to highlight an area on the chart
- Select the Reset option
- You will now notice that the chart has been returned to its original state

...
- クリックしてドラッグし、グラフの領域を強調表示します。
- 「リセット」オプションを選択します。
- グラフが元の状態に戻ります。
互換性のないグラフ
| Styleclass | ||
|---|---|---|
| ||
- Histogram
- Z Chart
- Maps
- Meters
- Waterfall
- Event
- Week Density
- Trellis (not compatible with exclude brushing)
- Auto Charts (not compatible with exclude brushing)
- ヒストグラム
- Zグラフ
- マップ
- メーターグラフ
- 滝グラフ
- イベントグラフ
- 週密度グラフ
- 格子グラフ(含めないブラッシングと互換性なし)
- おまかせグラフ(含めないブラッシングと互換性なし)
注意:グラフのブラッシングは、ドリルエニウェアまたはドリルスルーが有効化されている場合は使用できません。Note: chart brushing is not available when Drill Anywhere or Drill Through is enabled.
| horizontalrule |
|---|
| Styleclass | ||
|---|---|---|
| ||