30日間の無料評価版をお試しいただけます。

Versions Compared

Key

  • This line was added.
  • This line was removed.
  • Formatting was changed.

Anchor
top
top

Table of Contents
classcontents

Getting Started

Styleclass
ClasstopLink

...

Raster Map

There are two styles of heat maps available using Yellowfin. Those created from GIS data or those created via an image (Raster Map). The image will contain all the regions for your data. These images work by substituting a unique colour in your image with a new colour based on the value of data in your report.
To begin making Raster Maps you will need to have:

...

Setting up a Map via Administration Options

Styleclass
ClasstopLink

...

Raster Map

For this section of the tutorial you will need an image and text file we have provided. Please download WorldHeatMap.png and WorldHeatMapCodes.txt .

...

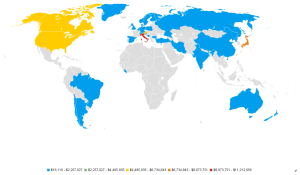
Adding a heat map into a report

Styleclass
ClasstopLink

...

Raster Map

Once a Raster Image has been added into your available list of images you can add these into a report. This section describes how it would be done using the standard Ski Team Tutorial view.

...

Section
Column
width30%

You should now have a map that more closely resembles the original image. Now that you have finished your map, save and close it.

Column
width70%


horizontalrule
Styleclass
ClasstopLink

...

Raster Map