Page History
...
| Table of Contents | ||
|---|---|---|
|
...
概要
| Styleclass | ||
|---|---|---|
| ||
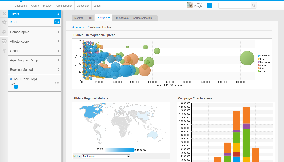
The benefits of this style of tab include:
このスタイルのタブには以下のような利点があります:
- データのスライスやダイスが簡単にできます。即座にデータの複数のディメンション(次元)とビューでドリルダウンできます。
多数の関連レポートを1つのタブに素早く表示できます。
- Data is easy to slice and dice - users can quickly drill down on multiple dimensions and views of their data
Multiple related reports can be displayed on a single tab for quick access
Styleclass Class hide See also: Standard Tab with Analytic Links
...
レポートのリンク
| Styleclass | ||
|---|---|---|
| ||
Link Filters
| Expand |
|---|
|

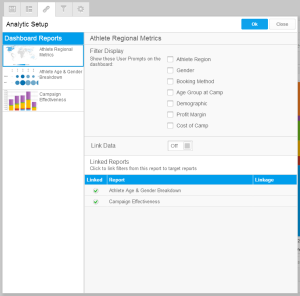

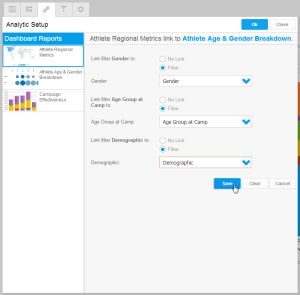
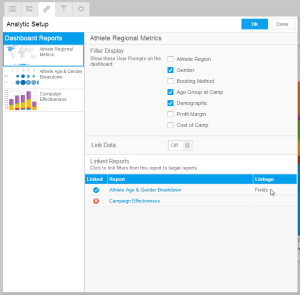
See Filter Values for more information.
Link Time Slider
| Expand |
|---|
|
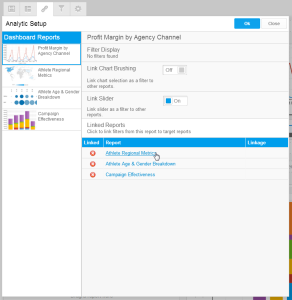
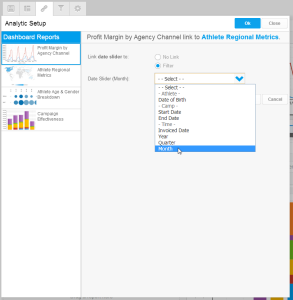
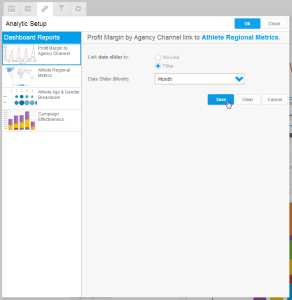
See Time Series for more information.
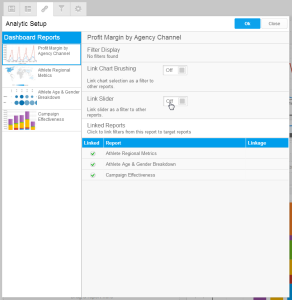
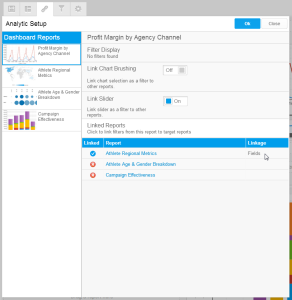
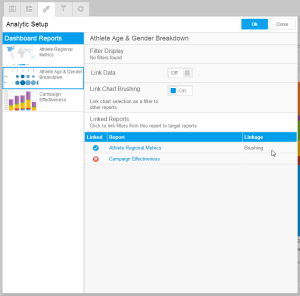
Link Chart Brushing
| Expand |
|---|
|

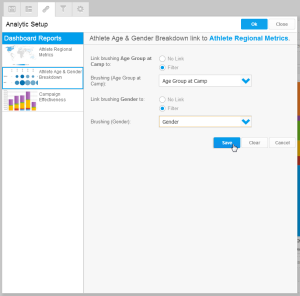
Note: Linked Brushing cannot be used at the same time as Linked Drill Down. When one option is enabled, the other becomes unavailable.
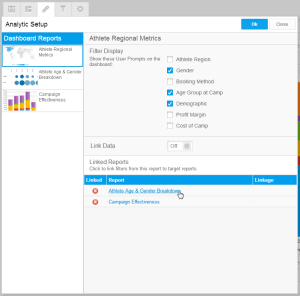
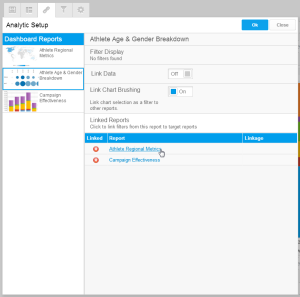
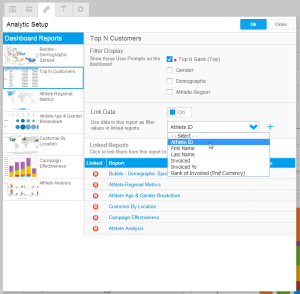
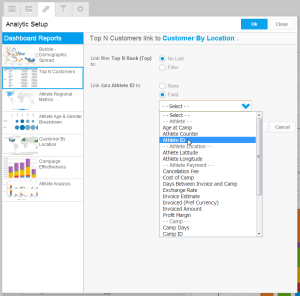
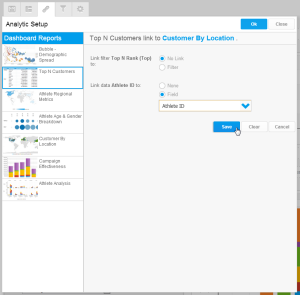
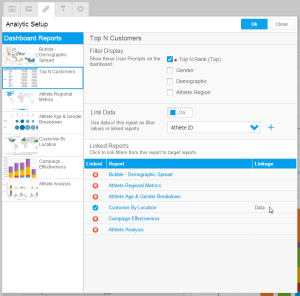
Link Data
| Expand |
|---|
|
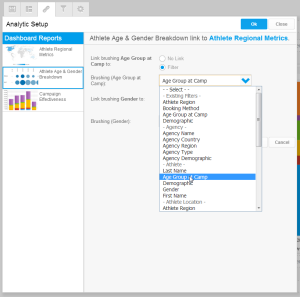
Link Drill Down
| Expand |
|---|
|
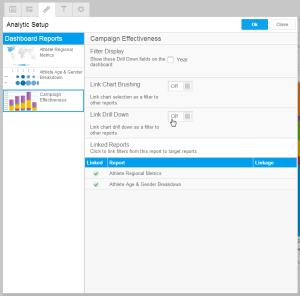
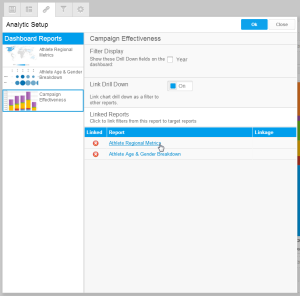
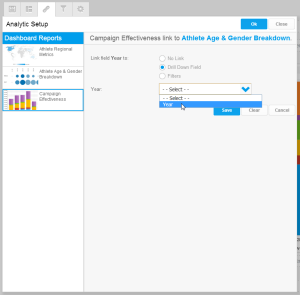
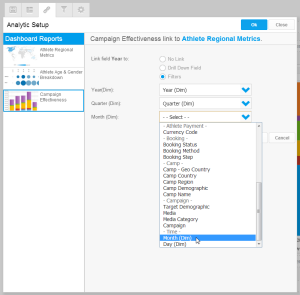
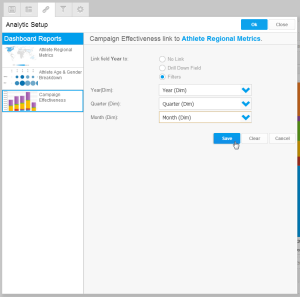
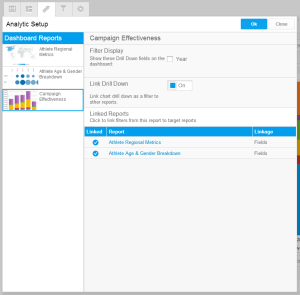
Note: Linked Drill Down cannot be used at the same time as Linked Brushing. When one option is enabled, the other becomes unavailable.
See Drill Down Hierarchies and Drill Down Reports for more information.
Formatting Filters
| Styleclass | ||
|---|---|---|
| ||
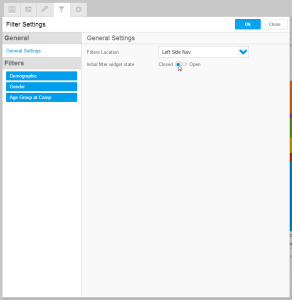
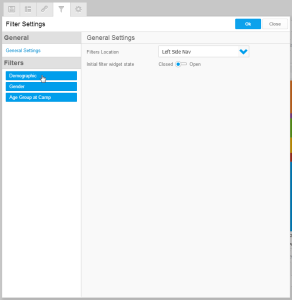
 . From here you will see a list of Dashboard Filters on the left side of the setup menu, with General Settings currently selected.
General Settings
This allows you to define the location of the filters. Depending on what you select you will provided with additional options such as the location of the Apply button, or the initial status of the panel.
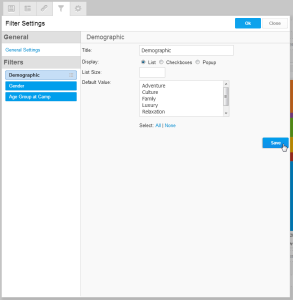
Filter Settings
Clicking on a filter in the list of the left of the panel allows you to customise the display of the filter.
Click Save to apply changes
Filter Grouping
This is only available if you have your filters set to display outside of the left navigation panel.
まず、新しい標準タブを設定するために、以下の手順に従います:標準タブの作成
フィルターのリンク
| Expand | ||
|---|---|---|
| ||
|
詳細については、フィルター値を参照してください。
タイムスライダーをリンク
| Expand | ||
|---|---|---|
| ||
|
詳細については、タイムシリーズを参照してください。
グラフのブラッシングをリンク
| Expand | ||
|---|---|---|
| ||
|
注意:ブラッシングのリンクは、ドリルダウンのリンクと同時に使用することはできません。一方のオプションを有効にすると、もう一方は使用不可能になります。
データをリンク
| Expand | ||
|---|---|---|
| ||
|
ドリルダウンをリンク
| Expand | ||
|---|---|---|
| ||
|
注意:ドリルダウンのリンクは、ブラッシングのリンクと同時に使用することはできません。一方のオプションを有効にすると、もう一方は使用不可能になります。
詳細については、ドリルダウン階層またはドリルダウンレポートを参照してください。
フィルターの書式
| Styleclass | ||
|---|---|---|
| ||
設定メニューの左側に、ダッシュボードフィルターの一覧が表示され、「標準設定」が選択されています。標準設定
フィルターの場所を定義することができます。選択内容に応じて、追加のオプション(「適用」ボタンの場所やパネルの初期ステータスなど)を設定します。
フィルター設定
パネル左側の一覧でフィルターをクリックすると、フィルターの表示をカスタマイズすることができます。
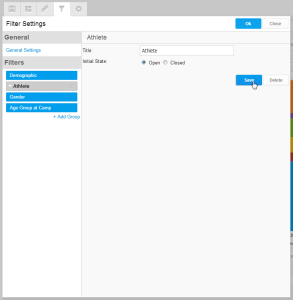
「保存」をクリックして変更を適用します。
フィルターグループ
左側のナビゲーションパネルの外部に表示されるようにフィルターが設定されている場合のみ使用できます。
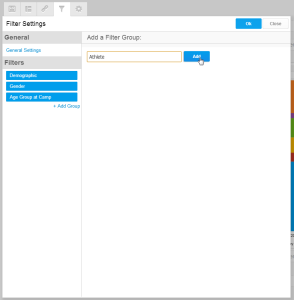
- 「+ グループの追加」をクリックします。
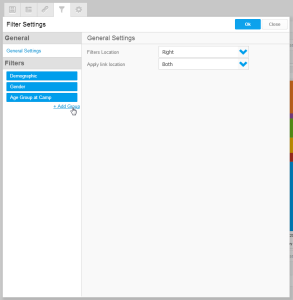
- グループの名前を入力し、「追加」をクリックします。
- グループを所定の位置にドラッグします。グループの下にあるすべてのフィルターがそのグループ内に格納されます。
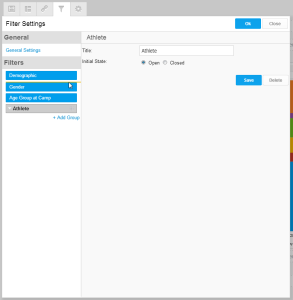
- グループをクリックして、書式を設定します。
- Click + Add Group
- Enter a name for the grouping and click Add
- Drag the group into place. Any filters below the group will be contained within it.
- Click on the group to format it
| horizontalrule |
|---|
| Styleclass | ||
|---|---|---|
| ||