Page History
...
| Table of Contents | ||
|---|---|---|
|
...
概要
| Styleclass | ||
|---|---|---|
| ||
| Wiki Markup |
|---|
{html}<iframe width="700" height="394" src="https://www.youtube.com/embed/ScHi5y1VI2kfqz-byADCkU?color=white" frameborder="0" allowfullscreen></iframe>{html} |
This section describes how to use the view builder to create views of your database that end users can access for reporting purposes. These views are built by first creating an entity relationship diagram which joins all required tables together.
Benefits of the Yellowfin View Builder
By using the Yellowfin view builder you can optimise the SQL that will be generated by the query. For example if you create a view where multiple tables are joined – Yellowfin will only select data from the tables necessary to return data required for the report. This means that you can create relatively complex views without compromising on performance.
For example you may want to build a fairly complex view that provides significant flexibility to your end users (more fields and tables). In general reports that are written will not include all possible fields. In this way you can deliver less views to your end users therefore reducing the administration complexity.
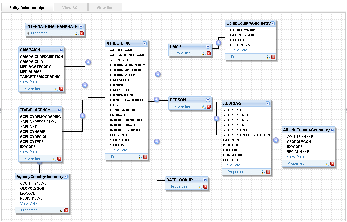
What is a Relationship Diagram?
A relationship diagram is a representation of a database view that shows the tables and joins between those tables. Using the Yellowfin View Builder you can create a relationship diagram for a sub set of your source database.
The relationship diagram contains tables and joins. The tables contain columns to which you apply a metadata so that business end users can use for creating reports.
The joins link the tables so that the correct data is returned for queries that are run on more than one table.
You build your relationship diagram on the canvas by selecting tables from the source database using table list. You create joins to link the tables. When you have built the relationship diagram for your view, you can test the view using integrity and impact analysis checks.
このセクションでは、エンドユーザーがレポート作成に使用できるデータベースビューをビュービルダーを利用して作成する方法を説明します。これらのビューは、必要なすべてのテーブル間の結合を設定することで構築されます。
ビュービルダーの利点
Yellowfinのビュービルダーを利用すると、クエリーで生成されるSQLを最適化することができます。たとえば、複数のテーブルが結合されたビューを作成する場合、Yellowfinでは、レポートで求められるデータを返すために必要なデータしかテーブルから選択しません。すなわち、パフォーマンスを落とすことなく比較的複雑なビューを作成することができるということです。
また別の例では、エンドユーザーに対して、かなりの柔軟性を持たせた比較的複雑なビューを作成するとします(さらに多くのフィールドとテーブルを使用)。作成されるレポートには、可能なフィールドすべてが含まれているわけではありません。この場合、エンドユーザーには、より少ないビューを提供することができるので、管理の煩雑さが軽減されます。
関連図とはなんですか?
関連図は、複数のテーブルとそれらの間の結合関係を示したものです。Yellowfinのビュービルダーを使用して関連図を作成することで、ソースデータベースのサブセットを構築することができます。
関連図はテーブルとその結合で構成されます。これらのテーブルは、エンドユーザーがレポートを作成するために使用するカラムが含まれています。
複数のテーブルに対するクエリーが正しいデータを返すよう、テーブル間の結合関係を定義します。
まず、テーブル一覧を使用して、ソースデータベースからキャンバスにテーブルをドラッグ&ドロップします。次にテーブル同士の結合関係を定義します。図が完成したら、ビューの完全性と影響関係をチェックします。
ドラッグ&ドロップビルダー
...
| Styleclass | ||
|---|---|---|
| ||
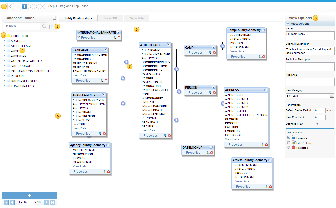
- The process wizard assists you to move between the various steps in building your view.
- The search and expand option allows you to search for tables in your data base
- The virtual table allows you to create your own tables using freehand SQL.
- The data base tables allow you to view all the available tables in your data source.
- Drag the table to resize the table list and expand the size of your canvas.
- The canvas – it is on this section that you drop your tables and create joins between them.
- Create Joins that link your tables together
- View options – manage the view details and table properties.
Database Table List
The list of database tables assists you to build your relationship diagram. Use the Table List to view and select tables in your database that you want to add to your view.
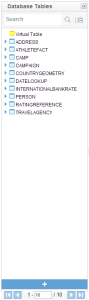
By expanding the node next to a table name you display the fields for the table. The list also provides an indication if the element selected is a table or a database view.
| Database table |
| Database View |
| Virtual Table |


Note: the number of default tables shown is a configuration item – 50 is the default
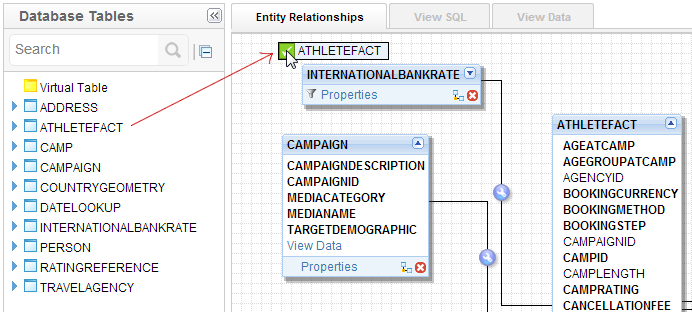
Drag Table onto Canvas
You start building your view by selecting available tables from the source system and dragging them onto the Design Canvas.
Multiple Table Versions & Aliases
In your view you can drag multiple versions of the same table. This may be needed if you which to access the same table but in different ways.
- プロセスウイザードを使って、ビューの作成ステップの間を移動できます。
- 「検索と展開」オプションでは、データベース内のテーブルを検索できます。
- 仮想テーブルをキャンバスに配置すれば、SQLエディターを使用して新しいテーブルを作成することができます。
- データベーステーブルには、データソースの利用可能なテーブルの一覧を表示します。
- テーブルをドラッグして、テーブル一覧のサイズを変更したり、キャンバスを拡大したりします。
- テーブルをドラッグ&ドロップし、テーブル間の結合関係を定義するためのキャンバスです。
- テーブル間をリンクさせる結合関係を作成します。
- 「ビューオプション」欄でビューの詳細とテーブルのプロパティを設定できます。
データベーステーブル一覧
データベーステーブルの一覧は関連図の作成を支援します。表示されている一覧から、ビューに加えたいテーブルを選択してください。
テーブル名の左にあるアイコンをクリックするとその内容が表示されます。また、個々のエレメントがテーブルかビューであるかも示されます。
| データベーステーブル |
| データベースビュー |
| 仮想テーブル |
注意:初期表示されるテーブルの数は設定可能です。デフォルトは50です。
テーブルをキャンバスにドラッグ
データベーステーブルからビューに含めるテーブルを選び、キャンバスの上にドラッグします。
複数のテーブルバージョンと別名
ビューには、同じテーブルを複数ドラッグすることができます。この機能は同じテーブルに異なる方法でアクセスしたい場合に有用です。
詳細については、テーブルプロパティを参照してください。See テーブルプロパティ for more information.
| horizontalrule |
|---|
| Styleclass | ||
|---|---|---|
| ||