Page History
...
| Table of Contents | ||
|---|---|---|
|
...
概要
| Styleclass | ||
|---|---|---|
| ||
Drill down allows you step down a logical hierarchy within your data by re-calculating your report each time you move down a hierarchy.
For example you may be looking at a sales report by region. To determine why one region is outperforming another you can click on the region to see the various countries performances within that region.
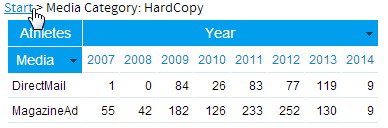
Each time you drill down the value that you selected becomes a filter for the next level down. You will not see all countries when drill down – just the countries for the region you selected.
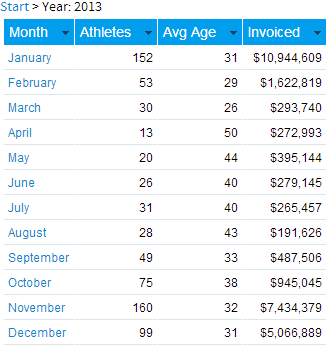
For example you may be able to drill from
Year > Month > Date.
When you click on the link to the report will refresh with detail updated.
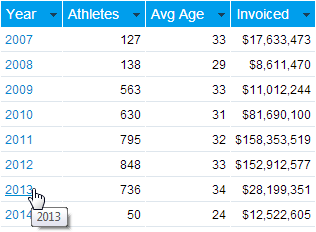
For example if your report contained region and you clicked on Europe the refreshed report will display all countries within Europe.
Initial Setup
When your administrator sets up your view they can define dimension hierarchies. These hierarchies are built to enable you to explore your data in a way that is appropriate for your business.
In the example above your administrator would have set the view up to build a time based hierarchy.
Year drills to > Month drills to > Date
Having done this Yellowfin re-calculates your report data as you move down the hierarchy.
The common areas for which hierarchies are created include:
- Geography (Region, Country, State)
- Date (Year, Quarter, Month, Week, Date).
- Organisation Structure (Division, Line of Business, Cost Centre)
- Customer (Country of Origin, Region, City, Customer).
- Product (Category, Line, Product Code)
See Drill Down Hierarchies for more information.
ドリルダウンは、ユーザーがデータの論理的階層関係をトレースすることを可能にします。
たとえばここに、地域別の販売レポートがあるとします。ある地域だけがなぜ突出して良い成績を上げているか知りたいとき、その地域をクリックするとそこに含まれる各国別の成績が表示されるわけです。
ドリルダウンが行われると、選択された値が次のレベルに対するフィルターとして働きます。地域別から国別のデータにドリルダウンした場合、表示されるのは選択された地域に含まれる国のデータだけです。
たとえば以下のようなドリルダウンが設定されているとします。
年 > 月 > 日
レポート上のリンクをクリックすると設定にしたがってレポートが更新されます。
レポートが地域別のデータを表示していた場合、「Europe」をクリックすると、レポートはヨーロッパ各国のデータを表示します。
初期設定
管理者は、ビューを設計する際それに含まれるディメンション(次元)データに対して階層関係を定義することができます。それらの階層関係は、ユーザーのビジネスに適した形でデータの分析が容易になるよう構築されます。
上の例の場合、管理者はさらに時間ベースの階層を設けています。
年 > 月 > 日のドリルダウン
ユーザーがこの階層をたどるたび、Yellowfinはレポートのデータを再計算して表示します。
階層関係は一般的に以下のようなデータに対して構築されます。
- 地理情報(地域、国、州)
- 日付(年、四半期、月、週、日)
- 組織構造(部門、ビジネスライン、コストセンター)
- 顧客情報(国籍、地方、市区町村、顧客名)
- 製品情報(カテゴリー、ライン、製品コード)
詳細については、ドリルダウン階層を参照してください。
ドリルダウンの使用
...
| Styleclass | ||
|---|---|---|
| ||
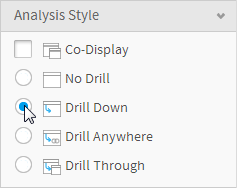
Analysis Style
There are four Analysis Styles; Drill Down, Drill Anywhere, Drill Through, and Co-Display. The Drill styles cannot be used simultaneously used on a report as the user action looks similar and this could lead to confusion for a user that has not created the report.
To select the type of analysis you wish to apply click the Drill Down radio button on the Analysis Style panel of the Data step.
Add Drill Fields to your Report
- Locate the fields that you wish to add to your report. All fields that are drill able will be identifiable by the line which joins them in the report field’s box.
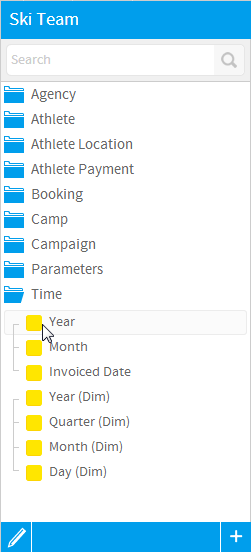
- Select the level of the hierarchy that you wish to start your analysis from, generally this is the top level.
Note: you cannot add multiple fields from the same hierarchy onto a report – for example you cannot add Region and Country on the same report when using drill down – since you can drill from region to country.
...
| Wiki Markup |
|---|
{html}<iframe width="700" height="394" src="https://www.youtube.com/embed/iaJTVbIPiso?color=white" frameborder="0" allowfullscreen></iframe>{html} |
分析スタイル
「分析スタイル」には、「ドリルダウン」、「ドリルエニウェア」、「ドリルスルー」、および「マルチ表示」の4つがあります。これらのドリルスタイルはユーザーアクションが似ており、レポートを作成していないユーザーに混乱を招く可能性があるため、1つのレポートで同時に使用することはできません。
適用する分析のタイプを選択するには、「データ」ステップの「分析スタイル」パネルにある「ドリルダウン」ラジオボタンをクリックします。
ドリルフィールドの追加
- レポートに追加するフィールドを特定します。ドリルダウンが可能なフィールドは、データフィールド欄に線で結ばれて表示されています。
- 分析の起点とする階層のレベルを選択してください(通常は最高レベルです)。
注意:1つのレポートに対して同じ階層構造から複数のフィールドを追加することはできません。たとえば、ドリルダウンを使うときには同じレポートに地方と国名の両方を追加することはできません。これは、地方から国名へのドリルダウンができるためです。
多階層ドリルダウン
| Styleclass | ||
|---|---|---|
| ||
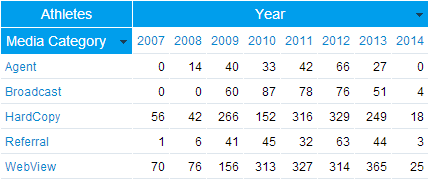
When adding in multiple hierarchies it is suggested to use a Crosstab report so that the data is presented in a way that is easier to read and understand.
In the example below you can drill down on either the Year or Booking Method.
...
複数のドリルダウンをレポートに追加する場合、データの分析をより容易にするために表形式にクロス集計を選択することをお勧めします。
以下の例では、「Year」または「Booking Method」のいずれかでドリルダウンすることができます。
ドリルアップ
| Styleclass | ||
|---|---|---|
| ||
...
レポートのリセット
| Styleclass | ||
|---|---|---|
| ||
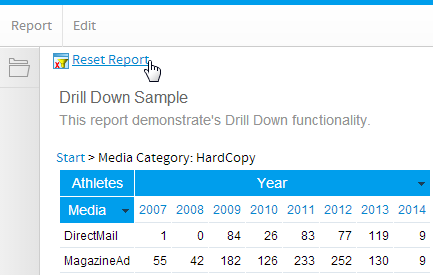
To reset a report you can either click the Reset Report link located under the main navigation bar, or the Start link on the drill breadcrumb.
...
レポートをリセットするには、メインナビゲーションバーの下にある「レポートのリセット」をクリックするか、階層をドリルする各リンクから「開始」リンクをクリックします。
グラフのドリルダウン
| Styleclass | ||
|---|---|---|
| ||
- Place your cursor over the value you wish to drill on.
- Click the area of the chart
- The chart will be refreshed with new data.
...
- マウスカーソルをドリルダウンしたい値の上に移動します。
- グラフのその値の領域をクリックしてください。
- グラフはドリルダウンしたデータで再描画されます。
ドリルダウン結果の印刷、エクスポート
| Styleclass | ||
|---|---|---|
| ||
| horizontalrule |
|---|
| Styleclass | ||
|---|---|---|
| ||