Page History
...
| Table of Contents | ||
|---|---|---|
|
...
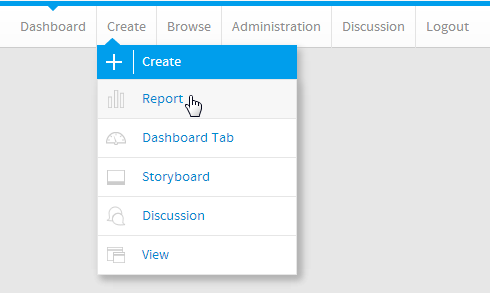
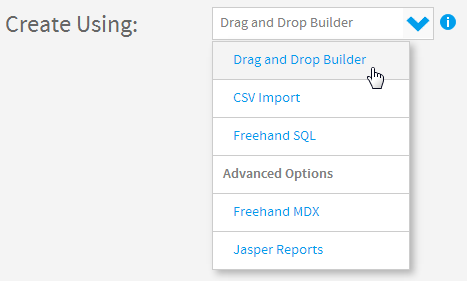
レポートの作成
| Styleclass | ||
|---|---|---|
| ||
| Section | ||||||||||
|---|---|---|---|---|---|---|---|---|---|---|
|
| Section | ||||||||||
|---|---|---|---|---|---|---|---|---|---|---|
|
| Section | ||||||||||
|---|---|---|---|---|---|---|---|---|---|---|
|
...
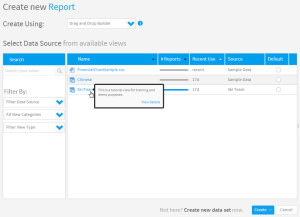
データ設定
| Styleclass | ||
|---|---|---|
| ||
| Section | ||||||||||
|---|---|---|---|---|---|---|---|---|---|---|
|
...
フィルター設定
| Styleclass | ||
|---|---|---|
| ||
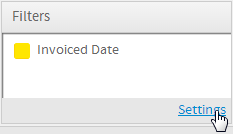
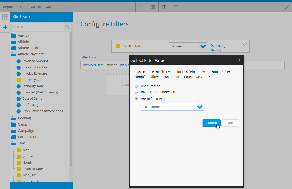
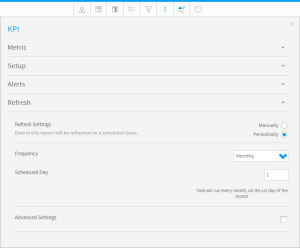
The Spot KPI type requires a refresh schedule to be defined in order to take a snapshot of the metric value at regular points in time. This generates the trend line shown on the KPI Tab. In order to ensure each snapshot records the right range of data, a filter may need to be used as well.
「KPIの種類」が「スポット」の場合、メトリック値のスナップショットを定期的に取得するために、更新スケジュールを定義する必要があります。これにより、「KPIタブ」に表示されるトレンドラインが生成されます。各スナップショットに適切な範囲のデータが記録されるように、フィルターの使用も必要になる場合があります。
この例では、毎月1日に実行されるように更新スケジュールを設定します。つまり、1か月分のデータのスナップショットを取得します。この更新スケジュールを設定するため、フィルターを追加して、結果を前月のデータに制限します。I this example we are going to set the refresh schedule to run on the first of each month. This means that we want the snapshot to capture a month's worth of data. In order to set this up we will add a filter to restrict the results to last month's data.
| Section | ||||||||||
|---|---|---|---|---|---|---|---|---|---|---|
|
| Section | ||||||||||
|---|---|---|---|---|---|---|---|---|---|---|
|
...
KPI設定
| Styleclass | ||
|---|---|---|
| ||
| Section | ||||||||||
|---|---|---|---|---|---|---|---|---|---|---|
|
...
| Section | ||||||||||
|---|---|---|---|---|---|---|---|---|---|---|
|
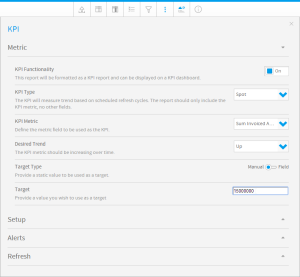
スポット
KPIレポートでは、標準レポートでは必要のない複数のコンポーネントを定義する必要があります。最初に、監視対象となるメトリック(数値)を設定する必要があります。
| Section | ||||||||||
|---|---|---|---|---|---|---|---|---|---|---|
|
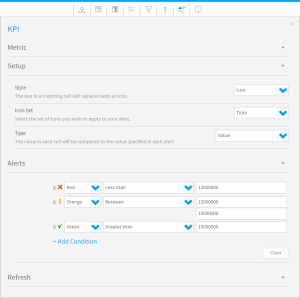
KPIアラート
...
KPIレポートに必要な次のコンポーネントは、ダッシュボードでKPIの左側に表示される条件付き書式アラートです。このアイコンまたは色によって、値の現在の状態に関するアラートが表示されます。
| Section | ||||||||||
|---|---|---|---|---|---|---|---|---|---|---|
|
...
KPI更新スケジュール
| Section | ||||||||||
|---|---|---|---|---|---|---|---|---|---|---|
|
...
レポートの保存
| Styleclass | ||
|---|---|---|
| top||
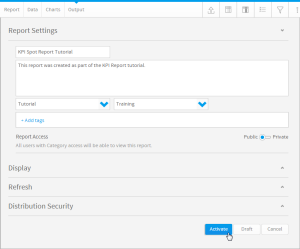
レポートを完成して有効化するには、「保存」メニューを完成する必要があります。
| Section | ||||||||||
|---|---|---|---|---|---|---|---|---|---|---|
|
...
KPIレポートが完成し、KPIダッシュボードタブに追加する準備ができました。
詳細については KPIタブ を参照してください。
| horizontalrule |
|---|
| Styleclass | ||
|---|---|---|
| ||