Page History
...
| Table of Contents | ||
|---|---|---|
|
...
概要
| Styleclass | ||
|---|---|---|
| ||
KPI Tabs are a unique dashboard tab which present reports to the user in the form of KPI metrics. These assist an organisation to understand its goals and objectives – essentially, the direction in which they want the enterprise to progress. To help with this analysis key performance indicators (KPIs) are laid down to assess the present state of the business.
The KPI tab differs from a standard dashboard tab in that Reports are run as a regular task against predefined targets – the results include:
- Current Status
- Trend of the report over time
- Actual versus target and variance
- And the last relevant time period (as displayed below)
Benefits of this style of tab include:
- Data is easy to interpret – users can quickly identify which business measures are on target or not.
- Multiple Metrics can be displayed on a single tab for quick access
- Trends in the report are displayed providing users with an understanding of both current status and direction of the data.
See also: KPI Tab Tutorial
...
KPIタブは、KPI指標一覧形式でレポートを表示するダッシュボードタブです。これは組織において目標と進捗を理解するためのものです。KPI(Key Performance Indicators - 重要業績評価指標)の分析は、ビジネスの現在状況の把握を助けます。
KPIタブは通常のダッシュボードタブと違い、レポートがあらかじめ設定されたターゲットに対するタスクとして実行されます。その結果は以下を含みます:
- 現在状況
- ここまでの傾向
- 目標と実際の相違
- 最終日時(以下のように表示されます)
このスタイルのタブには以下のような利点があります:
- データ理解が容易:ユーザーはどのビジネス指標が目標を達成しているか、あるいはいないかをたちどころに把握できます。
- 多数の数値を1つのタブに素早く表示できます。
- レポートの傾向を表示することで、データの現在状況と方向性を一時に理解することができます。
参照:: KPIタブのチュートリアル
KPIタブの作成
| Styleclass | ||
|---|---|---|
| ||
- The creation of a KPI tab is similar to a standard tab. Simply click the Create option in the main navigation bar, select Dashboard Tab > KPI Tab.
- This will return you to the tab where you can add reports by searching for them in the report list in the left hand side and dragging them onto portlets.
See KPI Reports and ダッシュボード for more information.
...
- KPIタブの作成プロセスは普通のタブの場合とそう変わりません。メインナビゲーションバーの「作成」オプションをクリックし、「ダッシュボードタブ」>「KPIタブ」を選択します。
- 左側のレポート一覧で検索を実行してポートレットにドラッグし、レポートを追加できるタブに戻ります。
KPIタブの利用
| Styleclass | ||
|---|---|---|
| ||
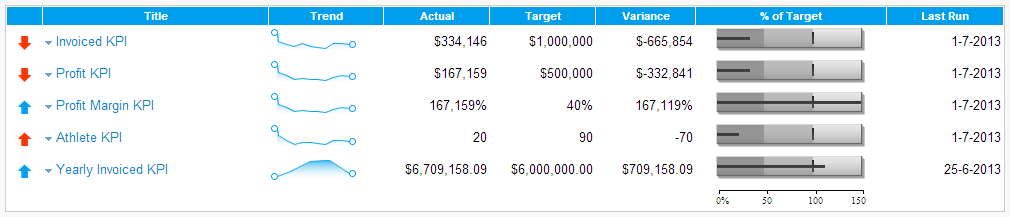
KPIタブを利用することでユーザーはそのKPIの現状と傾向を素早くつかむことができます。The KPI tab structure allows you to quickly browse the status and trend of your Key Performance Indicators.

ステータス | この欄には目標値に対する現在のステータスがアイコンで表示されます。 |
メニュー | このドロップダウンメニューを使ってKPIレポートの表示、電子メール印刷、エクスポートなどを行えます。 |
タイトル | KPI値の名前です。クリックすると詳細が表示されます。 |
傾向 | Tこの欄には、現在の状態を直前のレポートと比べて良くなっているかどうかがアイコンで表示されます。 |
実績 | レポートに読み込まれた現在の値が表示されます。 |
目標 | 設定された目標値が表示されます。 |
差異 | 目標値と現在値の差が表示されます。 |
%対目標値 | バレットチャートは、パフォーマンスを視覚化し、すべてのメトリック(数値)を対等に比較するのに役立ちます。 |
最終実行 | KPIに関連して設定された最終日時が表示されます。 |
Status | The status will display an icon that indicates whether or not the measure has met your target thresholds. |
Menu | The menu drop down lets you manage the KPI report. You can view, print email, and export it. |
Title | The title of the KPI metric. Click on the hyperlink to see detail. |
Trend | The trend compares the current version of the KPI report run with the previous versions and indicates whether there has been a change in the trend, the direction of the trend and whether the trend is good or bad. |
Actual | The current actual value of the metric as returned in the report. |
Target | The target value as set for the KPI metric |
Variance | The difference between the Actual and Target values. |
% of Target | A bullet chart that assists you to visualize performance and compare all metrics on an equal basis. |
Last Run | The specific date for when the KPI is relevant. |
| horizontalrule |
|---|
| Styleclass | ||
|---|---|---|
| ||