30日間の無料評価版をお試しいただけます。

Versions Compared

Key

  • This line was added.
  • This line was removed.
  • Formatting was changed.
Comment: Migration of unmigrated content due to installation of a new plugin

Anchor
top
top

...

Googleマップチュートリアル

Styleclass
ClasstopLink

...

ページトップ

Wiki Markup
{html}<iframe width="700" height="394" src="https://www.youtube.com/embed/i4Z7obB2PtQ?color=white" frameborder="0" allowfullscreen></iframe>{html}

...

Section
Column
width30%

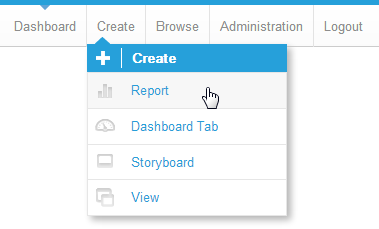
1. Click on the Create link and select Report to begin building your report.作成」リンクをクリックして、「レポート」を選択しレポートの作成を開始します。

Column
width70%

Section
Column
width30%

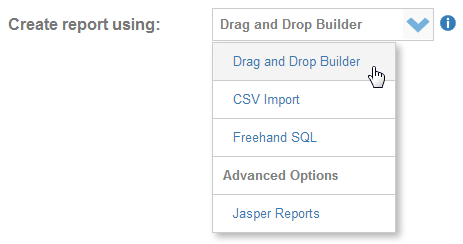
2. You should now be on the Initialise Report page. Select the Drag and Drop Builder as the build tool.「新規レポート作成」ページが表示されます。レポートの作成方法として、「ドラッグ&ドロップビルダー」を選択します。

Column
width70%

Section
Column
width30%

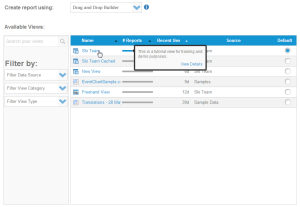
3. Select ビューとして「Ski Team as the View.」を選択します。

4. Now click the Image Removed button to proceed.Image Added」ボタンをクリックして次に進みます。

Column
width70%

Section
Column
width30%

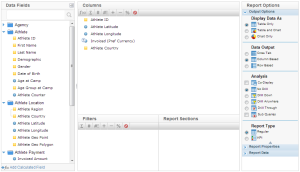
5. Add the Athlete ID, Athlete Longitude, Athlete Latitude, Invoiced 「Athlete ID」、「Athlete Longitude」、「Athlete Latitude」、「Invoiced (Pref Currency), and および「Athlete Country fields to your report.」の各フィールドをレポートに追加します。

6. Set the report to display as a Chart Only. レポートの表示を「グラフのみ」として設定します。

7. Click the Image Removed Next image to continue. Image Added次へ」をクリックして続行します。

Column
width70%

Section
Column
width30%

8. On the output page click on the Chart Icon to edit the chart and set up your Google Map. 表示ページで、グラフアイコンをクリックしてグラフを編集しGoogleマップを設定します。

Column
width70%

Section
Column
width30%

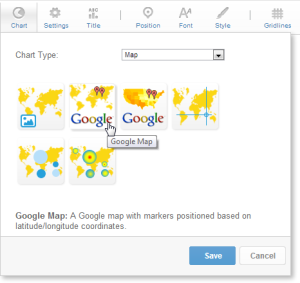
9. From the Chart Menu select Map.10. Next select the Google Map type. Click Save to save your selection. 「グラフ」メニューから「マップ」を選択します。

10. 次に、「Googleマップ」タイプを選択します。「保存」をクリックして選択を保存します。

Column
width70%

Section
Column
width30%

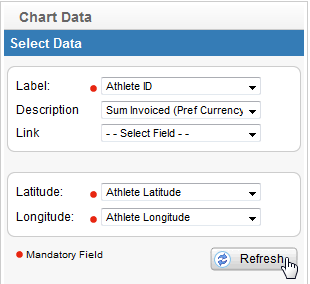
11. You will now see the Chart Data section updated with fields relevant to Google Maps. 「グラフデータ」セクションがGoogleマップに関連するフィールドで更新されたことがわかります。

12. Select the following: 次のように選択します。

ラベル:Label: Athlete ID
Description: 説明:Sum Invoiced (Pref)
Latitude: 緯度:Athlete Latitude
Longitude: 経度:Athlete Longitude

13. Click Refresh to display your chart.

Image Removed

 更新」をクリックして、グラフを表示します。

Image Added

注意:リンクは、地図の上にマウスカーソルを乗せたときに表示される吹き出しにハイパーリンクフィールドを挿入することができます。Note: The Link can be used to insert a Hyperlink field into the map rollover.

Column
width70%

Section
Column
width30%

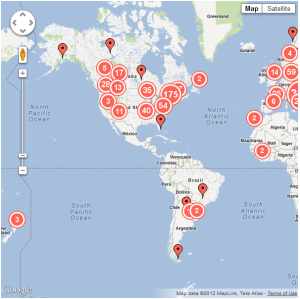
The data will be displayed as:
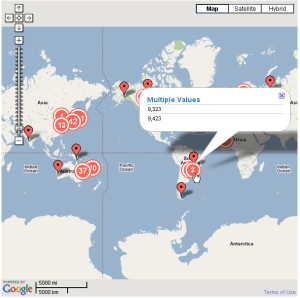
Image Removed Clusters (Grouped Points); and
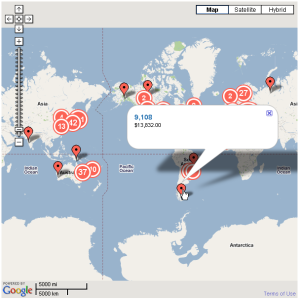
Image Removed Points.データは次のように表示されます。
Image Added クラスター(グループ化されたポイント)、および
Image Added ポイント

Column
width70%

Section
Column
width30%

14. The cluster behaves differently from a point. In the number in the middle of the cluster indicates the number of points. If you click on a cluster it will display the values within it. クラスターはポイントとは異なる動作をします。クラスター中央の数値は、ポイントの数を示しています。クラスターをクリックすると、その中の値が表示されます。

クラスターにズームインすると、個々のポイントが表示されます。As you zoom in the clusters will open up to show the individual points.

Column
width70%

Section
Column
width30%

15. The single data point will show the Label, Description and if selected, the Linked field on the roll over.  単一のデータポイントにはラベルと説明が示され、リンクフィールドを選択した場合は、マウスカーソルを乗せたときに表示される吹き出し上にリンクフィールドが示されます。

Column
width70%


horizontalrule
Styleclass
ClasstopLink

ページトップ


...