Page History
| Anchor | ||||
|---|---|---|---|---|
|
| Table of Contents | ||
|---|---|---|
|
...
概要
| Styleclass | ||
|---|---|---|
|
...
The Chart step formatting menu bar provides you with all the formatting options for your chart. You can use these options to change settings such as the legend, background, axis and label.
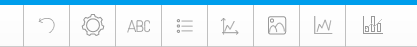
Note: the menus and items contained within them will change based on the type of chart you are using.
...
注意: 示されるメニューおよびメニュー内の項目は、使用するグラフのタイプによって異なります。
| Wiki Markup |
|---|
{html}<iframe width="700" height="394" src="https://www.youtube.com/embed/LVICB2vLtL8?color=white" frameborder="0" allowfullscreen></iframe>{html} |
リセット
| Styleclass | ||
|---|---|---|
|
...
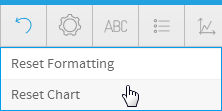
The Reset menu allows you to reset your chart or formatting options:
- Formatting: this will reset your formatting selections, but keep the chart type and field selections defined.
- Chart: this will reset your chart, including all formatting, field, and chart type selections, returning it to an empty state.
- 書式:選択した書式がリセットされますが、定義されているグラフタイプおよびフィールドの選択は保持されます。
- グラフ:すべての書式とフィールド、グラフタイプの選択を含め、グラフがリセットされ、空の状態に戻されます。
グラフの設定
...
| Styleclass | ||
|---|---|---|
|
...
| Expand | |
|---|---|
|
...
|
...
|
...
|
...
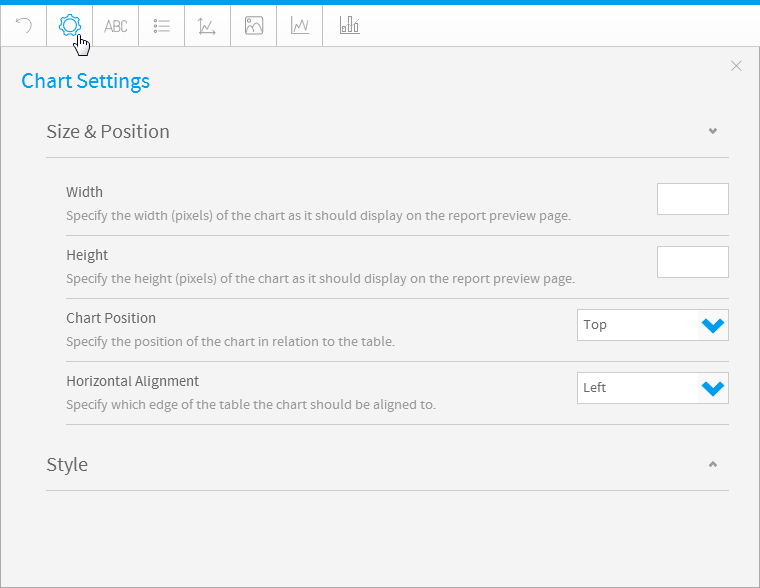
Width
...
Define the width of the chart in pixels. This option is used instead of resizing the chart using the dragging method.
...
Height
...
Define the height of the chart in pixels. This option is used instead of resizing the chart using the dragging method.
...
Chart Position
...
Specify the position of the chart in relation to the table.
...
Horizontal Alignment
...
Specify which edge of the table the chart should be aligned to.
|
...
| Expand | |
|---|---|
|
...
|
...
|
...
|
...
Yearly Comparison
...
Display multiple years on the x axis of the chart, with one line per series.
...
Units
...
Select the granularity of the dates to be displayed. Selecting a unit of finer granularity than your data will result in using the level of your data.
|
...
| Expand | |
|---|---|
|
...
|
...
|
...
|
...
Shading
...
Define whether the area has shading or is a solid colour.
...
Curved
...
Define whether the corners to the bars/columns will be curved or squared.
...
Glow
...
Define whether the bars/columns will have a glow applied.
...
Shadows
...
Define whether the bars/columns have a shadow applied.
...
Colour Set
...
The colour applied to this chart will be based the selection made. Possible options are; Metric, Monochrome, Configuration Defaults.
- Metric: The colour applied to this chart will be based the default colours applied to metrics in the view. If no colour was defined for a metric, configuration defaults will be used.
- Monochrome: The colour applied to this chart will be based on different shades of a single selected colour.
- Configuration Defaults: The colour applied to this chart will be based on the defaults defined in configuration.
- Reference Code: The colour applied to this chart will be based on the defaults applied to the Org Reference Code.
...
Colour
...
This is only available if Monochrome is selected above. Define the colour to be used for monochromatic colouring of the chart.
...
Opacity
...
Select the opacity percentage of the chart. The lower the percentage, the more transparent it is.
...
Other Segment
...
Select the % of total a segment must be smaller than in order to be grouped into an 'Other' segment. If 0 there is no grouping.
...
Shadow Colour
...
Define the colour of the shadow effect applied to the pie.
...
Outline Colour
...
Define the colour of the outline of the pie and segments.
...
Outline Width
...
Define the width of the outline of the pie and segments.
...
Pie Shading Style
...
Define the shading style to apply to the pie.
...
Start Position
...
Select the position relative to an analogue clock face that the first segment in the pie should start.
...
Explode Slice
...
Define which segment(s) of the pie should be split from the main pie.
...
Depth Factor
...
Select the percentage of the chart display to be used for the 3D height of the pie.
...
Keep Circular
...
Display the pie to fill the full chart area. This means the pie may be stretched so there is no empty space.
...
Hollow Shapes
...
Display the line shapes with a solid colour centre at each data point, or hollow, depending on the selection.
...
Curved Lines
...
Display straight or curved lines between each data point, depending on the selection.
...
Total Value
...
Define the total value contained in the proportional infographic image. If left blank the series total will be used. If the series total is less, there will be 'empty colour' for the rest of the image. If it is more, everything after the specified value will be ignored.
...
Empty Colour
...
Define the colour to be displayed if the specified Total Value is not met by the selected series.
...
Orientation
...
The image used by the proportional infographic will be filled from the top down.
...
Scale
...
Display a scale above the comparative infographic that shows the min and max values, and the central point.
...
Scale Font
...
Define the formatting for text displayed above the comparative infographic images.
...
Label Font
...
Define the formatting for the label text displayed below the comparative infographic images.
...
Text Font
...
Define the formatting for text displayed above the comparative infographic images.
...
Maintain Aspect Ratio
...
DDisplay the raster map using the same aspect ratio as the original image. This means that it will not be stretched and as such may leave some empty space.
...
Border Colour
...
Define a colour to be used as an outline for each region on the map.
|
| Expand | ||||||||||||||||||||||
|---|---|---|---|---|---|---|---|---|---|---|---|---|---|---|---|---|---|---|---|---|---|---|
| ||||||||||||||||||||||
|
| Expand | ||||||
|---|---|---|---|---|---|---|
| ||||||
|
| Expand | ||||||||||||||||
|---|---|---|---|---|---|---|---|---|---|---|---|---|---|---|---|---|
| ||||||||||||||||
|
| Expand | ||||||
|---|---|---|---|---|---|---|
| ||||||
|
| Expand | ||||
|---|---|---|---|---|
| ||||
|
| Expand | ||||||||||||
|---|---|---|---|---|---|---|---|---|---|---|---|---|
| ||||||||||||
|
タイトル
| Styleclass | ||
|---|---|---|
| ||
| Expand | ||||||||
|---|---|---|---|---|---|---|---|---|
| ||||||||
|
凡例
| Styleclass | ||
|---|---|---|
| ||
| Expand | ||||
|---|---|---|---|---|
| ||||
|
| Expand | ||||
|---|---|---|---|---|
| ||||
|
| Expand | ||||||||||
|---|---|---|---|---|---|---|---|---|---|---|
| ||||||||||
|
軸
| Styleclass | ||
|---|---|---|
| ||
| Expand | ||||||
|---|---|---|---|---|---|---|
| ||||||
|
| Expand | ||||||||||||||||||||||||||||||||||||||
|---|---|---|---|---|---|---|---|---|---|---|---|---|---|---|---|---|---|---|---|---|---|---|---|---|---|---|---|---|---|---|---|---|---|---|---|---|---|---|
| ||||||||||||||||||||||||||||||||||||||
軸のスタイルのドロップダウンメニューでは、軸に適用する書式を指定します。
|
| Expand | ||||||||||||
|---|---|---|---|---|---|---|---|---|---|---|---|---|
| ||||||||||||
このドロップダウンメニューを使って属性を設定できるのは通常はY軸に対してのみですが、XYグラフを使用していればX軸とY軸の両方に属性を設定できます。
|
背景
| Styleclass | ||
|---|---|---|
| ||
| Expand | ||||||||
|---|---|---|---|---|---|---|---|---|
| ||||||||
グリッド線オプションは、すべてのカテゴリーグラフやバブルグラフ、散布図で利用することができます。
|
| Expand | ||||||
|---|---|---|---|---|---|---|
| ||||||
グリッド線オプションは、すべてのカテゴリーグラフやバブルグラフ、散布図で利用することができます。
|
| Expand | ||||||||||||
|---|---|---|---|---|---|---|---|---|---|---|---|---|
| ||||||||||||
描画域は軸で区切られた領域で、この中にすべてのデータシリーズが表示されます。ドロップダウンメニューのオプションで、描画域に適用する背景色を設定することができます。
|
| Expand | ||||||||
|---|---|---|---|---|---|---|---|---|
| ||||||||
描画域は軸で区切られた領域で、この中にすべてのデータシリーズが表示されます。ドロップダウンメニューのオプションで、描画域に適用する背景色を設定することができます。
|
| Expand | ||||||||||||
|---|---|---|---|---|---|---|---|---|---|---|---|---|
| ||||||||||||
グラフ全体とそのエレメントはグラフ域として説明されます。ドロップダウンメニューのオプションで、グラフ域に適用する背景色を選択することができます。
|
| Expand | ||||||||
|---|---|---|---|---|---|---|---|---|
| ||||||||
グラフ全体とそのエレメントはグラフ域として説明されます。ドロップダウンメニューのオプションで、グラフ域に適用する背景色を選択することができます。
|
ラベル
| Styleclass | ||
|---|---|---|
| ||
オプション | 説明 |
|---|---|
ラベル | グラフ上の各値にラベルを表示します。 |
ラベルコンテンツ | 必要に応じて、ラベルの内容を指定します。
|
スタイル | グラフの凡例に書式を定義します。 |
ラベルのフォント | ラベルコンテンツにカスタムフォント書式を定義します。 |
ラベル線を非表示化 | グラフと各ラベルをつなぐ線を表示または非表示にします。 |
| Expand | ||||||||||||||||
|---|---|---|---|---|---|---|---|---|---|---|---|---|---|---|---|---|
| ||||||||||||||||
|
シリーズ
| Styleclass | ||
|---|---|---|
| ||
| Expand | ||||||||||||||
|---|---|---|---|---|---|---|---|---|---|---|---|---|---|---|
| ||||||||||||||
|
| Expand | ||||||
|---|---|---|---|---|---|---|
| ||||||
|
| Expand | ||||||
|---|---|---|---|---|---|---|
| ||||||
|
| Expand | ||||
|---|---|---|---|---|
| ||||
|
| Expand | ||||||||||
|---|---|---|---|---|---|---|---|---|---|---|
| ||||||||||
|
GIS設定
| Styleclass | ||
|---|---|---|
| ||
| Expand | ||||||||||||||||||
|---|---|---|---|---|---|---|---|---|---|---|---|---|---|---|---|---|---|---|
| ||||||||||||||||||
|
コンビネーショングラフ
| Styleclass | ||
|---|---|---|
| ||
| Expand | ||||||
|---|---|---|---|---|---|---|
| ||||||
|
| horizontalrule |
|---|
| Styleclass | ||
|---|---|---|
| ||
| Expand | ||||||||||||||||||||||
|---|---|---|---|---|---|---|---|---|---|---|---|---|---|---|---|---|---|---|---|---|---|---|
| ||||||||||||||||||||||
|
| Expand | ||||||
|---|---|---|---|---|---|---|
| ||||||
|
| Expand | ||||||||||||||||
|---|---|---|---|---|---|---|---|---|---|---|---|---|---|---|---|---|
| ||||||||||||||||
|
| Expand | ||||||
|---|---|---|---|---|---|---|
| ||||||
|
| Expand | ||||
|---|---|---|---|---|
| ||||
|
| Expand | ||||||||||||
|---|---|---|---|---|---|---|---|---|---|---|---|---|
| ||||||||||||
|
Title
| Styleclass | ||
|---|---|---|
| ||
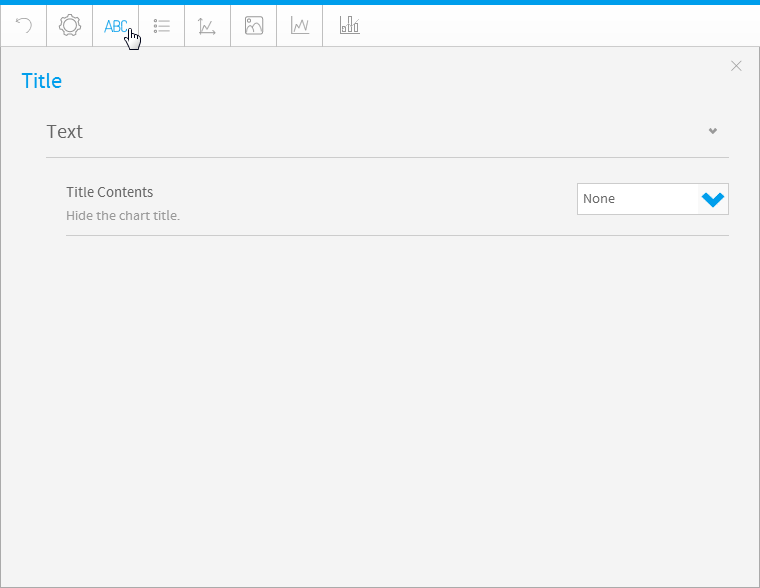
The title option allows you to change the title of the chart as well as the style – such as the font settings.
| Expand | ||||||||
|---|---|---|---|---|---|---|---|---|
| ||||||||
|
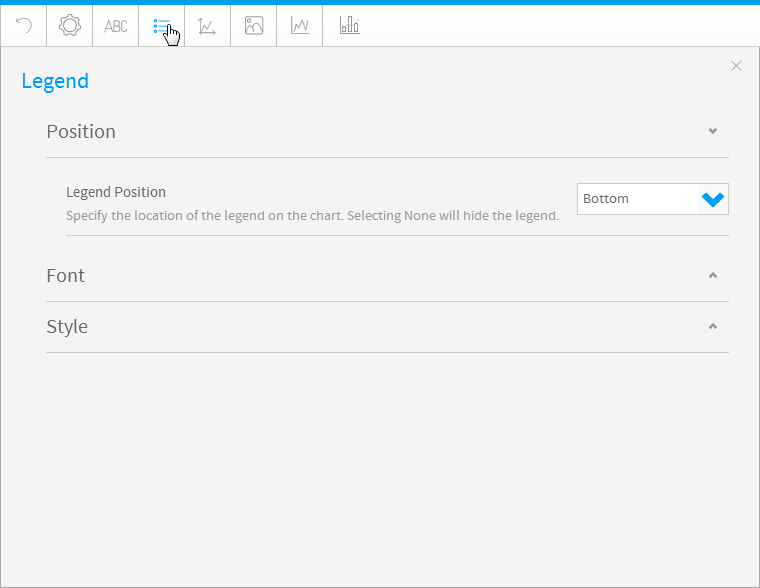
Legend
| Styleclass | ||
|---|---|---|
| ||
The Legend is a box that identifies the patterns or colours that are assigned to the data series or categories in a chart. This section of the menu lets you set the following options.
| Expand | ||||
|---|---|---|---|---|
| ||||
|
| Expand | ||||
|---|---|---|---|---|
| ||||
|
| Expand | ||||||||||
|---|---|---|---|---|---|---|---|---|---|---|
| ||||||||||
|
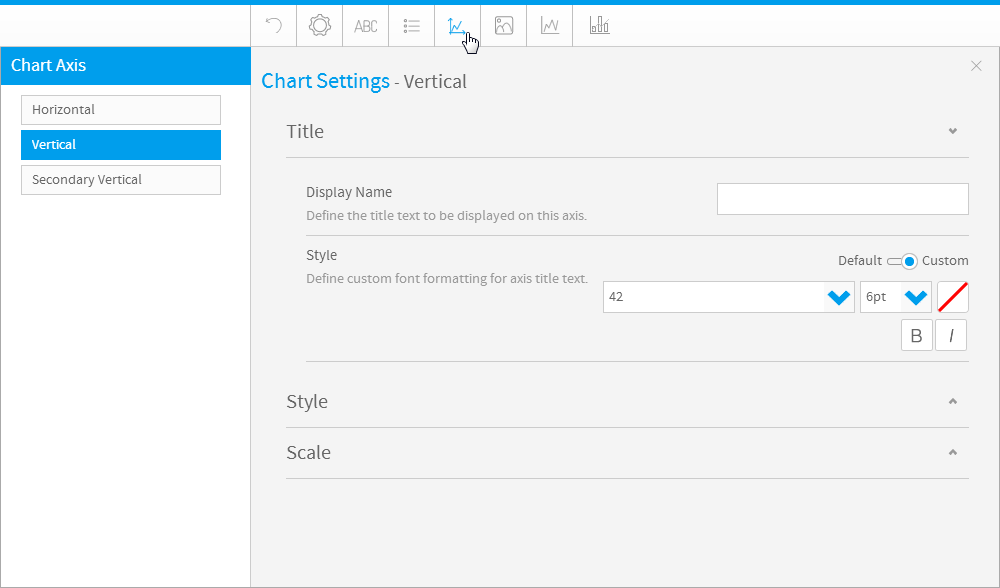
Axis
| Styleclass | ||
|---|---|---|
| ||
A line bordering the chart plot area used as a frame of reference for measurement. The y axis is usually the vertical axis and contains data. The x-axis is usually the horizontal axis and contains categories.
| Expand | ||||||
|---|---|---|---|---|---|---|
| ||||||
|
| Expand | ||||||||||||||||||||||||||||||||||||||
|---|---|---|---|---|---|---|---|---|---|---|---|---|---|---|---|---|---|---|---|---|---|---|---|---|---|---|---|---|---|---|---|---|---|---|---|---|---|---|
| ||||||||||||||||||||||||||||||||||||||
The Axis style drop down lets you determine the formats to be applied to axis.
|
| Expand | ||||||||||||
|---|---|---|---|---|---|---|---|---|---|---|---|---|
| ||||||||||||
The Axis scale drop down lets you determine the scale dimensions. Generally you will only be able to set the Y Axis attributes – unless you are using XY charts in which case you can set both X & Y attributes.
|
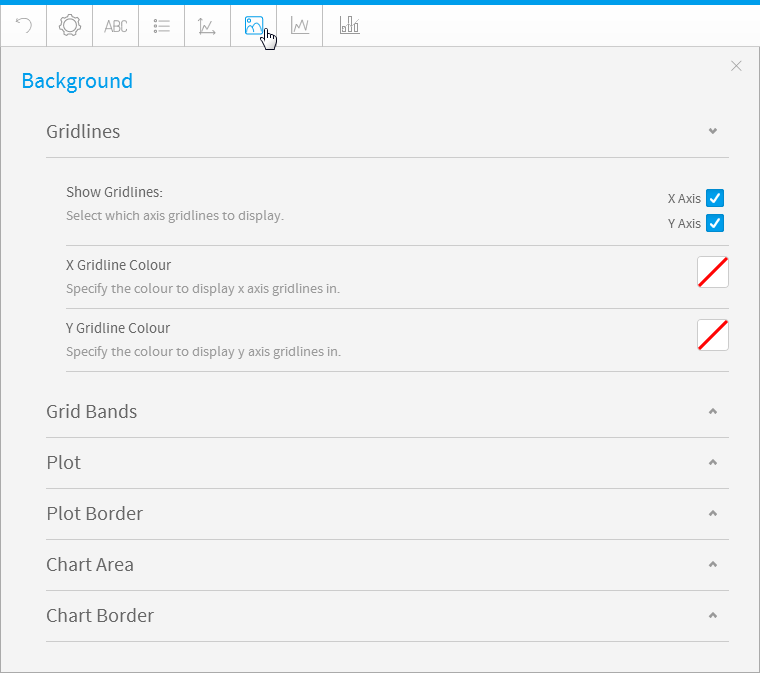
Background
| Styleclass | ||
|---|---|---|
| ||
The Background options let you set the style and colour of the main chart elements such as the plot and chart areas. You can apply elements such as background images and or gridlines.
| Expand | ||||||||
|---|---|---|---|---|---|---|---|---|
| ||||||||
Gridline options are available for all category charts, bubble and scatter charts.
|
| Expand | ||||||
|---|---|---|---|---|---|---|
| ||||||
Gridline options are available for all category charts, bubble and scatter charts.
|
| Expand | ||||||||||||
|---|---|---|---|---|---|---|---|---|---|---|---|---|
| ||||||||||||
The plot area is the area bounded by the axes, including all data series. The drop down options let you set the background colours applied to the plot area.
|
| Expand | ||||||||
|---|---|---|---|---|---|---|---|---|
| ||||||||
The plot area is the area bounded by the axes, including all data series. The drop down options let you set the background colours applied to the plot area.
|
| Expand | ||||||||||||
|---|---|---|---|---|---|---|---|---|---|---|---|---|
| ||||||||||||
The entire chart and all its elements are described as the chart area. The drop down options let you set the background colours applied to the chart area.
|
| Expand | ||||||||
|---|---|---|---|---|---|---|---|---|
| ||||||||
The entire chart and all its elements are described as the chart area. The drop down options let you set the background colours applied to the chart area.
|
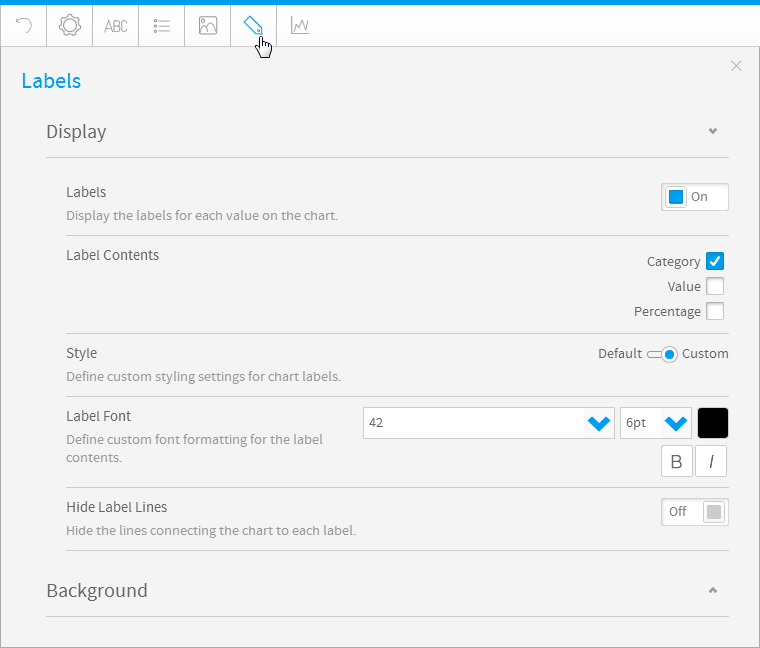
Labels
| Styleclass | ||
|---|---|---|
| ||
Labels can be added to charts to print out the values of the data point onto the chart in text format. Generally the formatting of label options are only available for pie charts.
| Expand | ||||||||||||
|---|---|---|---|---|---|---|---|---|---|---|---|---|
| ||||||||||||
|
| Expand | ||||||||||||||||
|---|---|---|---|---|---|---|---|---|---|---|---|---|---|---|---|---|
| ||||||||||||||||
|
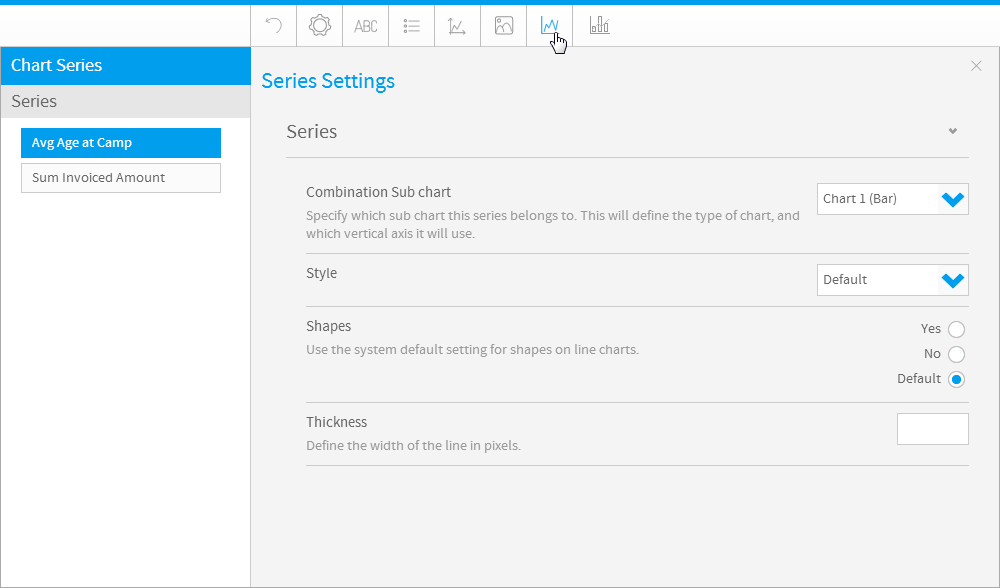
Series
| Styleclass | ||
|---|---|---|
| ||
| Expand | ||||||||||||||
|---|---|---|---|---|---|---|---|---|---|---|---|---|---|---|
| ||||||||||||||
|
| Expand | ||||||
|---|---|---|---|---|---|---|
| ||||||
|
| Expand | ||||
|---|---|---|---|---|
| ||||
|
| Expand | ||||
|---|---|---|---|---|
| ||||
|
| Expand | ||||||||
|---|---|---|---|---|---|---|---|---|
| ||||||||
|
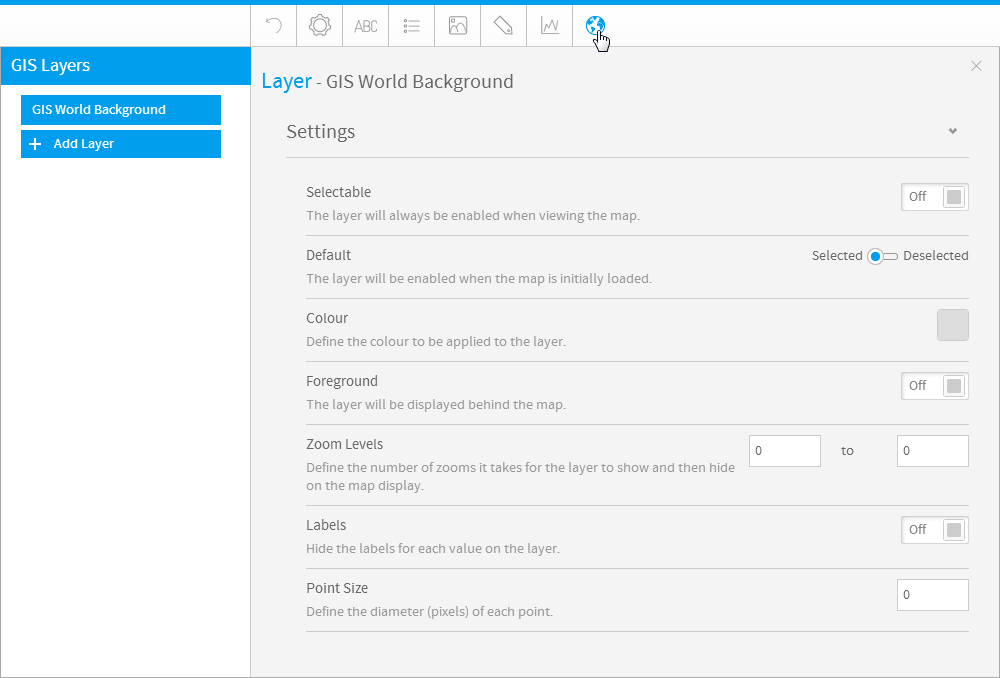
GIS Settings
| Styleclass | ||
|---|---|---|
| ||
| Expand | ||||||||||||||||||
|---|---|---|---|---|---|---|---|---|---|---|---|---|---|---|---|---|---|---|
| ||||||||||||||||||
|
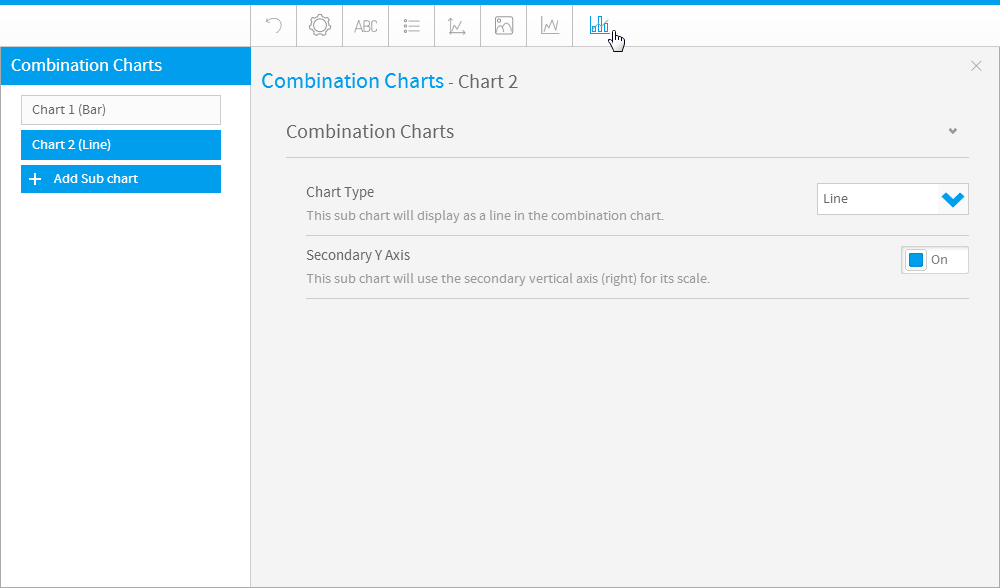
Combination Charts
| Styleclass | ||
|---|---|---|
| ||
| Expand | ||||||
|---|---|---|---|---|---|---|
| ||||||
|
| horizontalrule |
|---|
...
| Class | topLink |
|---|
...