Page History
| Anchor | ||||
|---|---|---|---|---|
|
| Table of Contents | ||
|---|---|---|
|
...
はじめに
| Styleclass | ||
|---|---|---|
|
...
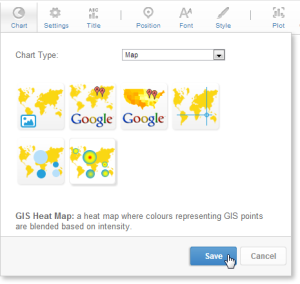
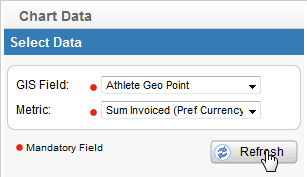
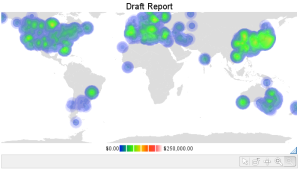
The GIS Heat Map is an advanced form of GIS Bubble Chart, which uses GIS Points to specify bubble positions, and a metric to specify the heat colour of the area.
...
GISマップチュートリアル
| Styleclass | ||
|---|---|---|
|
...
| Section | ||||||||||
|---|---|---|---|---|---|---|---|---|---|---|
|

| Section | ||||||||||
|---|---|---|---|---|---|---|---|---|---|---|
|
| Section | ||||||||||
|---|---|---|---|---|---|---|---|---|---|---|
|

| Section | ||||||||||
|---|---|---|---|---|---|---|---|---|---|---|
|
| Section | ||||||||||
|---|---|---|---|---|---|---|---|---|---|---|
|
| Section | ||||||||||
|---|---|---|---|---|---|---|---|---|---|---|
|

| Section | ||||||||||
|---|---|---|---|---|---|---|---|---|---|---|
|

| Section | ||||||||||
|---|---|---|---|---|---|---|---|---|---|---|
|
| horizontalrule |
|---|
| Styleclass | ||
|---|---|---|
| ||
...