Page History
| Anchor | ||||
|---|---|---|---|---|
|
| Table of Contents | ||
|---|---|---|
|
...
概要
| Styleclass | ||
|---|---|---|
| ||
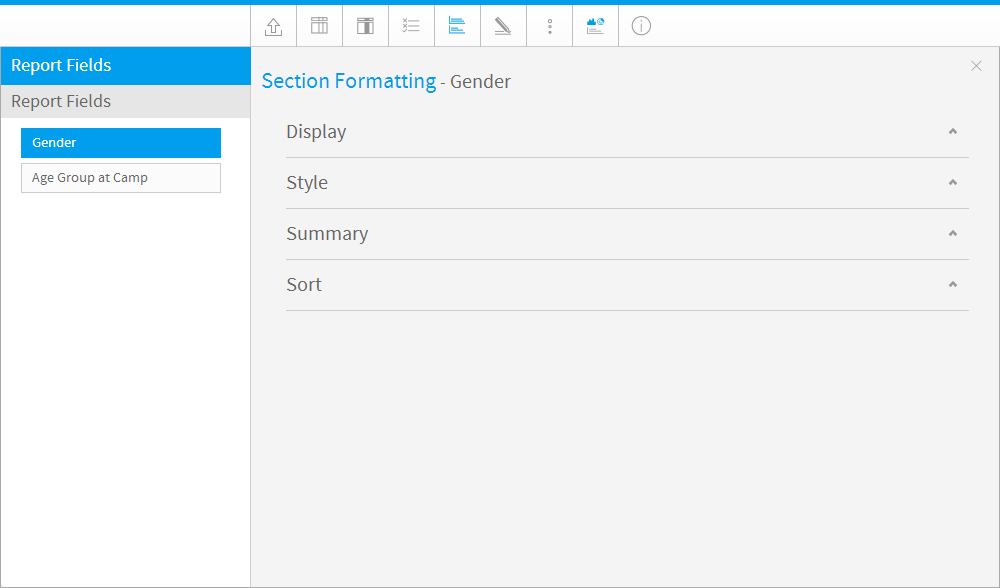
The Section format tab contains a number of menus that you can use to format the report sections. Each of these menus is described below.
Section Selection
| Styleclass | ||
|---|---|---|
| ||
Using the Report format menu and selecting the 'Section' tab you will be able to apply formatting and summaries for each section that you have in your report.
Navigate to the Section tab and if you have multiple sections in your report select the section you wish to format from the field drop down list.
Display
| Styleclass | ||
|---|---|---|
| ||
The display drop down option allows you to manage the options associated with how the section will be displayed on the report such as format.
Option | Description |
|---|---|
Display Name | To change the display name of the section from the default value simply update this field. |
Format | Each data type will have a unique set of format options - e.g. Text, Date or Numeric.
|
Chart Title | If you have charts on your section report there will be a separate chart for each section. To use the section name as the chart title check this item. |
Show Labels | If you wish to suppress the labels of the section uncheck this option and the column name will be removed but the section value will continue to be displayed. Note: this option is not available if the Section Style is set to Tabbed. |
Section Style |
|
Style
| Styleclass | ||
|---|---|---|
| ||
The Style drop down option allows you to change the style to be applied to the section. You can use default header, table title or custom settings for the section label format. Use the alignment options to change the alignment.
Option | Description |
|---|---|
Display Style | Select the display formatting to apply to the section.
|
Alignment | Select from Left, Centre, or Right. |
Summary
| Styleclass | ||
|---|---|---|
| ||
The Section Summary drop down allows you to apply various summaries to your section.
Option | Description |
|---|---|
Section Summary | To create a summary table at the top of your report it is possible to add in a section summary. This will summarise the metric columns which have been totalled and have a link on the section name to take you to the specific section within the report. |
Section Total | Section totals can be applied to any numeric value. When a section is added to the report an option to have the totals displayed for all numeric values is available. |
Show Labels | Display the labels with section summaries. Note: this option is only available when the Section Total option is selected. |
Grand Totals | A grand total can also be displayed at the end of the report. This will sum all the sections into one total. To active this function you need to select the Grand total option in the summary drop down. |
See Summaries for more information.
Sort
| Styleclass | ||
|---|---|---|
| ||
Option | Description |
|---|---|
Direction | Select to sort the sections Ascending or Descending. |
「セクションの書式」タブにはいくつかのメニューが用意されており、これらを使ってレポートのセクションの書式を編集することができます。
各セクションの内容を以下に示します。
| Expand | ||||||||||||
|---|---|---|---|---|---|---|---|---|---|---|---|---|
| ||||||||||||
|
| Expand | ||||||||||
|---|---|---|---|---|---|---|---|---|---|---|
| ||||||||||
|
| Expand | ||||||||||
|---|---|---|---|---|---|---|---|---|---|---|
| ||||||||||
|
| Expand | ||||
|---|---|---|---|---|
| ||||
|
詳細については、 セクション を参照してください。
| horizontalrule |
|---|
| Styleclass | ||
|---|---|---|
| ||


