Page History
| Anchor | ||||
|---|---|---|---|---|
|
| Table of Contents | ||
|---|---|---|
|
...
概要
| Styleclass | ||
|---|---|---|
|
...
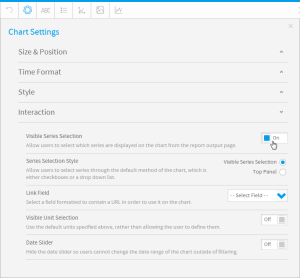
This option will allow you to toggle between the series that you have selected for your chart (if Bar, Line style etc) or those that are available in your data set when only a single series can be selected for that chart type (Pie, Map).
Note: this option is not available for charts used in section reports.
注意:このオプションは、セクションレポートで使用されているグラフでは使用できません。
| Wiki Markup |
|---|
{html}<iframe width="700" height="394" src="https://www.youtube.com/embed/CeaIQJc1PJU?color=white" frameborder="0" allowfullscreen></iframe>{html} |
設定
...
| Styleclass | ||
|---|---|---|
|
...
In order to set up Series Selection on a chart, you will need to have multiple metrics you can select from in the Chart Builder. From here it's just a matter of selecting the Visible Series Selection option in the Settings menu. Note: if you are using a time series chart you will also have the option to select the display type, demonstrated here with the Left Panel option.
The result is the option for the user to select which series they are viewing on the chart itself, as shown:
結果として、下図のように、表示するシリーズをユーザーが選択するオプションがグラフ自体に示されます。
シリーズ選択のタイプ
...
| Styleclass | ||
|---|---|---|
|
...
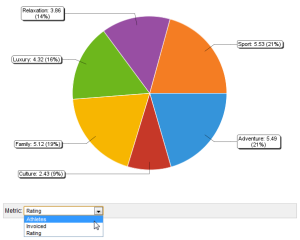
Single Series Display
If you are using a chart type that only has the capacity to display one metric at a time, such as a pie, you will have a drop down list appear at the bottom of your chart, as shown here.
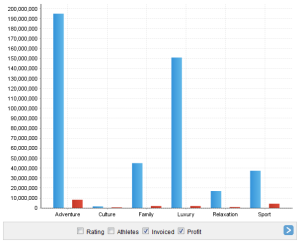
Multiple Series Display
If you have selected a chart type that is compatible with multiple metric display, such as a bar or line, the result will be check boxes, as below.
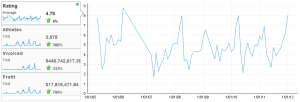
Time Series Display
If you are using a time series label, you will be able to choose from a standard series selection display (as above), or a panel display, shown below.
単一シリーズの表示
一度に1つのメトリックしか表示できないグラフタイプ(円グラフなど)を使用している場合は、下図のように、グラフの下部にドロップダウンメニューが示されます。
複数シリーズの表示
複数のメトリック表示と互換性のあるグラフタイプ(棒グラフや線グラフなど)を選択した場合は、下図のように、結果はチェックボックスになります。
タイムシリーズの表示
タイムシリーズのラベルを使用している場合は、標準のシリーズ選択の表示(前出)、または以下に示すパネル表示から選択できます。
| horizontalrule |
|---|
| Styleclass | ||
|---|---|---|
|
...