Page History
| Anchor | ||||
|---|---|---|---|---|
|
| Table of Contents | ||
|---|---|---|
|
...
概要
| Styleclass | ||
|---|---|---|
|
...
Most of the formatting options available to you are accessed through the report and chart format menu. However, once your report has been generated you can use some drag and drop formatting options to change the layout of your report.
The drag and drop formatting are only available whilst a report is in DRAFT mode. If the report is ACTIVE you will not see these options.
...
ドラッグ&ドロップによる調整が可能なのはドラフト(編集中)モードのレポートのみです。有効化されたレポートではこれらの機能は使用できません。
グラフのリサイズ
| Styleclass | ||
|---|---|---|
|
...
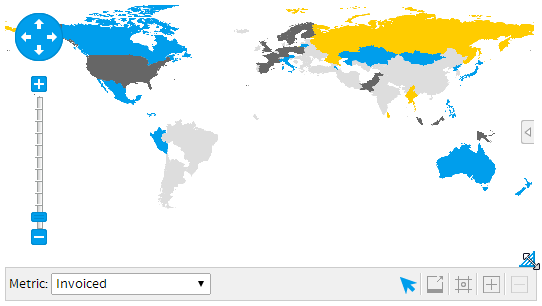
Charts can be resized whilst your report is in draft mode. This allows you to determine the exact fit of the chart on your report.
- When in DRAFT a chart will have a resize icon in the bottom right hand corner. Click the icon and hold.
- Drag your chart into the size that you require. A transparent version of the chart will show you a representation of the chart size.
- Let go of the cursor to set the chart size
...
- 編集中のグラフには右下にリサイズアイコンが表示されています。これをクリックしてください。
- そのまま必要なサイズにドラッグします。ドラッグ中は半透明なグラフが表示され、グラフのサイズを確認できます。
- カーソルを手放すと、グラフのサイズが設定されます。
グラフの配置
| Styleclass | ||
|---|---|---|
|
...
- グラフの非アクティブな領域をクリックしてください(たとえば空白スペース)。カーソルをクリックしたままにしてください。
- 表の周りのグラフを配置したい位置にカーソルをドラッグしてください。小さなグラフのアイコンが表示され、グラフの表示位置が示されます。
- カーソルを手放すとページが更新され、グラフの再配置が完了します。
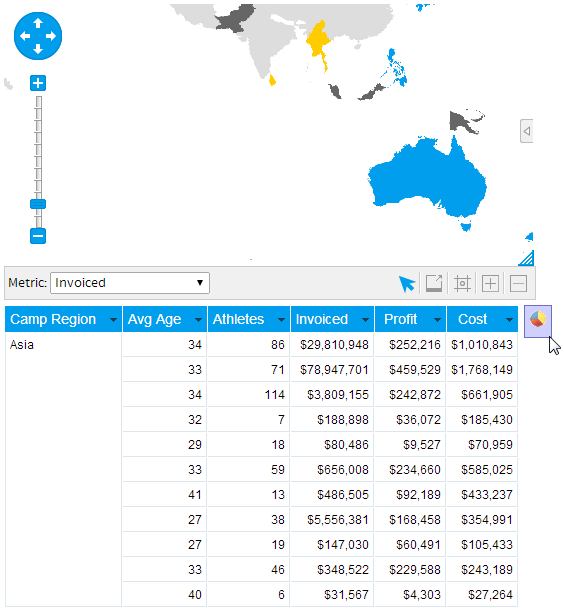
If you have selected table and chart display then you will be able to reposition your chart relative to the table on the report.
- Click on a non-active area of the chart. (eg white space) Hold down the cursor.
- Drag your cursor around the table to a point where you wish to place your chart. You will see a small chart icon indicates the position of the chart.
- Let go of the cursor and report will be refreshed with the chart in its new position.
| horizontalrule |
|---|
| Styleclass | ||
|---|---|---|
| ||
...