Page History
| Anchor | ||||
|---|---|---|---|---|
|
| Table of Contents | ||
|---|---|---|
|
...
概要
| Styleclass | ||
|---|---|---|
|
...
'What if analysis' is a method of creating calculated fields which allow you to test scenarios. For example if you wish to create a budget formula but you are unsure of the revenue for the following period you could use calculations with a number of input parameters to define the budget value.
What-If分析(仮説分析)は、テストシナリオを実施できる、計算フィールドの作成方法の1つです。たとえば、予算の式を作成する際に次期の収益が不確実な場合、入力パラメーターの数値から計算して予算の値を定義します。
What-If分析(仮説分析)のプランニング
...
| Styleclass | ||
|---|---|---|
|
...
Firstly you will have to define the columns that you wish to have as the output to your scenario. You will need to understand the major calculations you wish to apply including the input variables and their potential inputs.
たとえば売上収益でWhat-If分析(仮説分析)を行う場合、以下のパラメーターに基づいて計算を作成することができます:For example if you wish to conduct a 'What if' on Sales Revenue you may create a calculation based on the following parameters:
Lasts Years Sales Units * Price * < Price Change> * < Change of Sales Volume>
Where the < Field > represents user parameters that you want the user to input.
...
<価格変更> * <売上ボリュームの変更>
この中の< >で囲まれたフィールドは、ユーザーに入力させるユーザーパラメーターを表しています。
式の作成
| Styleclass | ||
|---|---|---|
|
...
To build a 'What if Analysis' formula you must have 'Parameters' defined on your view. A parameter is a special type of input field that is used to capture a value from the user and to use that value for calculations and filters.
The calculations for your What If are built using the Add Calculated Field method described above. However, you will need to make sure that you use parameter fields in your calculation.
If you wish to apply % changes to your calculations then ensure you assume the user will input values where 100% = 100 and not 1. This is because some of the input options work in whole number increments and not decimals.
Note: you can only use a single parameter for a single input. For example a parameter field that is to be used for % Price Change cannot be used to also Capture % Change in Sales Volume unless you wish both values to be identical.
...
What-If分析(仮説分析)を作成するには、ビューで定義したパラメーターが必要です。パラメーターは、ユーザーが入力した値を取り込むための特殊なタイプの入力フィールドで、計算とフィルターの値として使用されます。
計算では、これより以前に説明した計算フィールドの追加と同じ方式でWhat-If分析(仮説分析)が作成されます。ただし、計算でパラメーターフィールドを使用していることを確認しなければなりません。
計算に変化率(%)を適用する場合は、ユーザーが100%を1ではなく100として入力すると想定します。これは、一部の入力オプションは、増分の単位が小数ではなく整数になっているためです。
注意:パラメーターは、1つの入力につき1つだけ使用することができます。たとえば「%価格変更」に使用するパラメーターフィールドは、両方の値を同一にするつもりでない限り「%売上ボリューム変更」のパラメーターフィールドとして使用できません。
ユーザープロンプトの書式設定
| Styleclass | ||
|---|---|---|
|
...
Once your formulas have been defined you can drag these onto the report. You will note that any parameters included in those calculations will now appear in the filters section of your report data. This is because the parameter is treated somewhat like a user prompt filter.
On the report preview page you will be able to format your parameters to create dials and sliders for numeric fields.
Click on the Filters tab at the top of the page and select the parameter you wish you format. From here you will be able to edit the parameter options such as name and format etc.
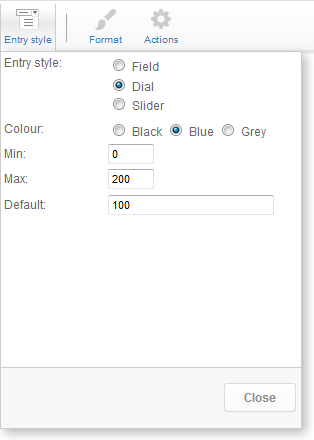
Option | Description |
|---|---|
Description | Give the parameter a usable name - this will be displayed on the user prompt. |
Default Value | The default value used to ensure that the parameter can work even if the user doe not immediately enter a value. |
Display Type | Choose how you want the user prompt to be displayed. You can use wither a text box, Dial or slider. |
Colour | If using a slider or dial choose the colour of the Slider or Dial |
Min | If using a slider or dial choose the minimum allowable value. |
Max | If using a slider or dial choose the maximum allowable value |
...
プレビューページでは、パラメーターに書式を設定して数値フィールドにダイアルとスライダーを作成することができます。
ページ上部の「フィルター」タブをクリックし、書式を設定するパラメーターを選択してください。ここで、名前や書式などのパラメーターオプションを編集します。
オプション | 説明 |
|---|---|
説明 | パラメーターに使用可能な名前を付けます。ここで付けた名前がユーザープロンプトに表示されます。 |
デフォルト値 | このデフォルト値を使用して、ユーザーが直接値を入力しなかった場合でも、必ずパラメーターを機能させます。 |
表示タイプ | ユーザープロンプトの表示方式を選択します。テキストボックス、ダイアル、またはスライダーのいずれかを使用することができます。 |
色 | スライダーやダイアルを使用する場合は、スライダーやダイアルの色を選択します。 |
最小 | スライダーやダイアルを使用する場合は、許容できる最小値を選択します。 |
最大 | スライダーやダイアルを使用する場合は、許容できる最大値を選択します。 |
What ifシナリオ(仮説シナリオ)の実行
| Styleclass | ||
|---|---|---|
|
...
表示されている入力手順でパラメーターをデフォルト値から変更すると、レポートのデータが計算フィールドのカラム(列)の新しい値で更新されて表示されます。Once all your calculations and parameters have been defined continue to the report output page. Here you will see the parameters being presented.
If you change the parameters from the default values using the input mechanisms presented you will see the data in your report updated in your calculated field columns with new values.
| horizontalrule |
|---|
| Styleclass | ||
|---|---|---|
| ||
...