Page History
| Anchor | ||||
|---|---|---|---|---|
|
| Table of Contents | ||
|---|---|---|
|
...
概要
| Styleclass | ||
|---|---|---|
|
...
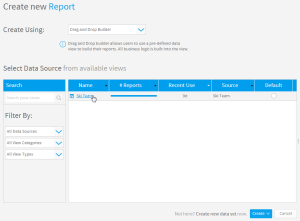
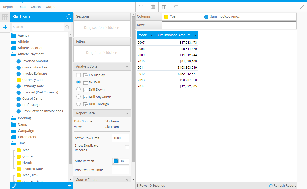
Having created our view we are now ready to create reports using the Report Writer. When creating a new report you will have begin with an initialisation step. The step is required for you to select the source system and the view you wish to access, as well as the type of builder you wish to use.
...
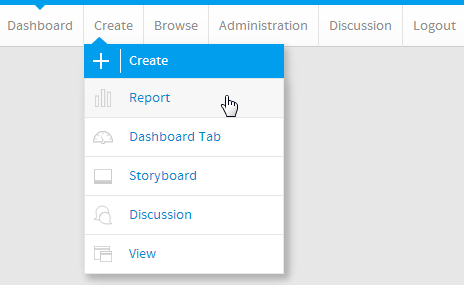
作成
| Styleclass | ||
|---|---|---|
|
...
| Expand | |
|---|---|
|
...
| |||||||
|
...
|
...
|
...
|
...
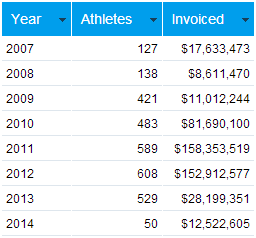
データ
| Styleclass | ||
|---|---|---|
|
...
| Expand | |
|---|---|
|
...
| ||||||
|
...
|
...
|
...
|
...
|
...
|
...
|
...
|
...
|
...
|
...
|
...
|
...
|
...
|
...
|
...
|
...
|
...
|
...
|
...
|
...
|
...
グラフ
| Styleclass | ||
|---|---|---|
|
...
| Expand | |
|---|---|
|
...
| |||||||
|
...
|
...
|
...
|
...
|
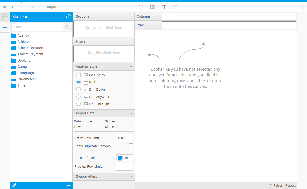
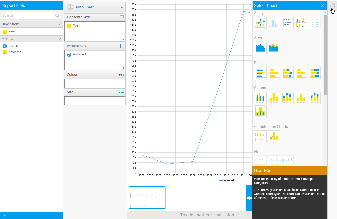
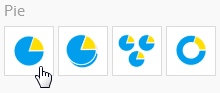
You will now have generated a line chart. In order to change the chart type manually, you will need to switch from the Auto Chart builder to a specific type.
|
...
|
...
|
...
|
...
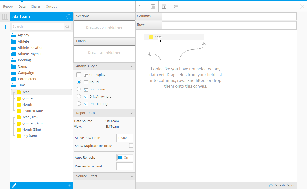
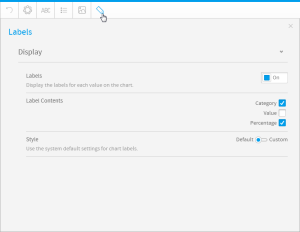
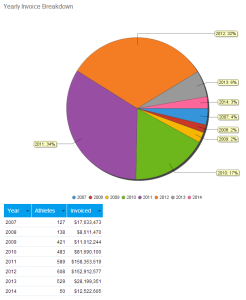
7. Set Labels display to On and select the Category and Percentage options.
|
...
|
...
|
...
表示
| Styleclass | ||
|---|---|---|
|
...
| Expand | |
|---|---|
|
...
| |||||||
|
...
|
...
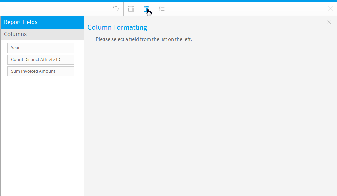
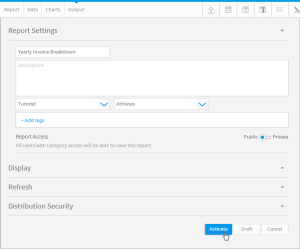
3. Define a Name and Description for the report, then provide Category and Sub Category options for storage.
|
...
|
...
|
...
追加情報
| Styleclass | ||
|---|---|---|
|
...
| horizontalrule |
|---|
| Styleclass | ||
|---|---|---|
|
...