Page History
...
| Table of Contents | ||
|---|---|---|
|
...
概要
| Styleclass | ||
|---|---|---|
| ||
...
設定
| Styleclass | ||
|---|---|---|
| ||
See Drill Down and Drill Through for more information.
Note: Ensure that the report drill through parameters and fields are the same that are used in your chart.
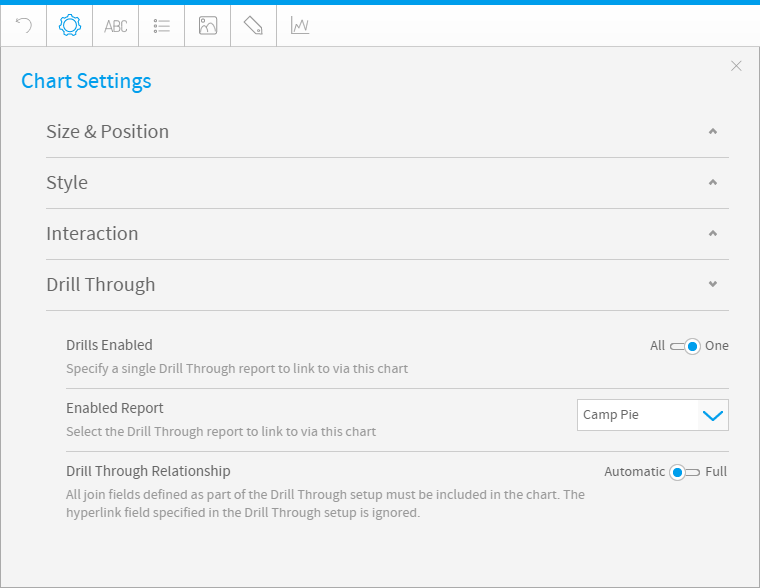
Chart Drill Through Settings
注意:レポートのドリルスルー設定とフィールドはグラフにおいても同様に機能します。
グラフのドリルスルー設定
グラフ作成時には、レポートに適用したドリル機能を有効化するために適用できる、さまざまなオプションがあります。When creating your chart(s) there are a range of options you can apply to enable drill functionality that you have applied to your report.
| Setting設定 | Optionオプション | Description説明 |
|---|---|---|
| Drill Enabledドリルの利用 | All | All of the compatible drill through relationships, defined on the Related Reports step of the builder, will be used on this chart. |
| On | Only one of the drill through relationships, defined on the Related Reports step of the builder, will be used on this chart. | |
| Enabled Report | (Report List) | Here you can define which Drill Through report relation is used on the chart. All others will be ignored for this chart. Note: This option is only available when Drills Enabled is set to One. |
| Drill Through Relationship | Automatic | The drill through relationships to be used on this chart will automatically be set up. For this to happen all the join fields defined in each relationship must be a chart component in order for the relationship to link correctly. The defined hyperlink field in the relationship is ignored as the link is automatically applied. |
| Full | The drill through relationships to be used in this report will be set up with whatever link fields are used in the chart, all other defined link fields will be omitted as part of the drill. The hyperlink field will be used as defined in the Related Reports step. |
Supported Charts
| すべて | ビルダーの「関連レポート」ステップで定義された互換性のあるドリルスルー関連付けすべてが、このグラフで使用されます。 | |
| 単一 | ビルダーの「関連レポート」ステップで定義されたドリルスルー関連付けのうち1つが、このグラフで使用されます。 | |
| 有効化されたレポート | (レポート一覧) | ここでは、グラフで使用するドリルスルーレポート関連付けを定義できます。 ほかのドリルスルーレポート関連付けはすべてこのグラフでは無視されます。 注意:このオプションは、「ドリルの利用」が「単一」に設定されている場合にのみ有効です。 |
| ドリルスルーの関連付け | 自動 | グラフで使用されるドリルスルーの関連付けが自動的に設定されます。このため、関連付けを正しく行うために、各関連付けで定義されるすべての結合フィールドはグラフの要素である必要があります。関連付けで定義されたハイパーリンクフィールドは、リンクが自動的に適用される場合無視されます。 |
| 完全 | レポートで使用されるドリルスルーの関連付けは、グラフで使用されるリンクフィールドの種類に関係なく設定でき、その他すべての定義済みのリンクフィールドはドリルから除外されます。ハイパーリンクフィールドは、「関連レポート」ステップで定義した通りに使用できます。 |
サポートされているグラフ
| Styleclass | ||
|---|---|---|
| ||
Note: All charts can use Link To drilling.
注意:すべてのグラフで、「リンク:To」ドリルを使用できます。
| グラフタイプ | グラフ | ドリルダウン | ドリルエニウェア | ドリルスルー |
|---|---|---|---|---|
| おまかせグラフ | 状況に応じて | |||
| Chart Type | Chart | Drill Down | Drill Anywhere | Drill Through |
| Auto Chart | Select Scenarios |  | | |
| Analytical分析 | Scatter散布図 | | | |
| Histogramヒストグラム |  | | | |
| Box & Whisker箱ひげグラフ | | | | |
| Trellis (Select Scenarios)格子グラフ(状況に応じて) | | | | |
| Heat Gridヒートグリッド | | | | |
| Areaエリアグラフ | Areaエリアグラフ | | | |
| Area (Time Series)エリアグラフ(タイムシリーズ) | | | | |
| Stacked Area積み上げエリアグラフ | | | | |
| Bar棒グラフ | Horizontal Bar横棒グラフ | | | |
| Horizontal Bar (Time Series)横棒グラフ(タイムシリーズ) | | | | |
| 3D Horizontal Bar3D横棒グラフ | | | | |
| Stacked Horizontal Bar積み上げ横棒グラフ | | | | |
| Stacked Horizontal Bar (Time Series)積み上げ横棒グラフ(タイムシリーズ) | | | | |
| Horizontal Cylinder横棒シリンダーグラフ | | | | |
| Proportional Bar比例棒グラフ | | | | |
| Columnカラム(列) | Vertical Column縦棒グラフ | | | |
| Vertical Column (Time Series)縦棒グラフ(タイムシリーズ) | | | | |
| 3D Vertical Column3D縦棒グラフ | | | | |
| Stacked Vertical Column積み上げ縦棒グラフ | | | | |
| Stacked Vertical Column (Time Series)積み上げ縦棒グラフ(タイムシリーズ) | | | | |
| Cylinderシリンダーグラフ | | | | |
| 3D Stacked Column3D積み上げ縦棒グラフ | | | | |
| Layered Column重ね縦棒グラフ | | | | |
| Combination Chartsコンビネーショングラフ | Combined Category複合カテゴリーグラフ | | | |
| Combined Category (Time Series)複合カテゴリーグラフ(タイムシリーズ) | | | | |
| Overlay Chartオーバーレイグラフ | | | Overlay Chart (Time Series) | |
| オーバーレイグラフ(タイムシリーズ) | | | | |
| Financial ファイナンシャルグラフ | Financial Lineフィナンシャル・線グラフ | | | |
| High Lowハイローグラフ | | | | |
| Candlestickロウソクグラフ | | | | |
| Line線グラフ | Line線グラフ | | | Line (Time Series) |
| 線グラフ(タイムシリーズ) | | | | |
| 3D Line3D線グラフ | | | | |
| Z ChartZグラフ | | | | |
| Stepped階段グラフ | | | | |
| Mapマップ | Raster Mapラスターマップ | | | |
| Google MapGoogleマップ | | | | |
| GIS Google MapGoogleマップ | | | | |
| GIS MapGISマップ | | | | |
| GIS Bubble MapGISバブルマップ | | | | |
| GIS Heat MapGISヒートマップ | | | | |
| Pie円グラフ | Pie円グラフ | | | |
| 3D Pie3D円グラフ | | | | |
| Multi Pieマルチ円グラフ | | | | |
| Ringリンググラフ | | | | |
| Special Purpose特殊用途 | Funnelじょうごグラフ | | | |
| Proportional Infographic比例インフォグラフィック | | | | |
| Comparative Infographic比較インフォグラフィック | | | | |
| Radarレーダーグラフ | | | | |
| Waterfall滝グラフ | | | | |
| Eventイベントグラフ | | | | |
| Week Density週密度グラフ | | | | |
| Digital Numeric Displayデジタル数字表示 | | | | |
| Numeric Display数字表示 | | | |
| horizontalrule |
|---|
| Styleclass | ||
|---|---|---|
| ||