Overview
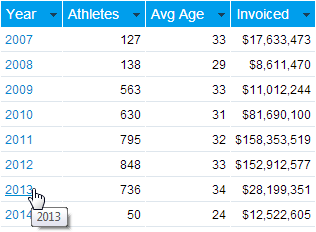
Yellowfin has drill down functionality available for its reports and charts. This provides you with the option to drill down logical hierarchies within your data, viewing data from different angles and levels.
Drill down allows you step down a logical hierarchy within your data by re-calculating your report each time you move down a hierarchy.
For example you may be looking at a sales report by region. To determine why one region is outperforming another you can click on the region to see the various countries performances within that region.
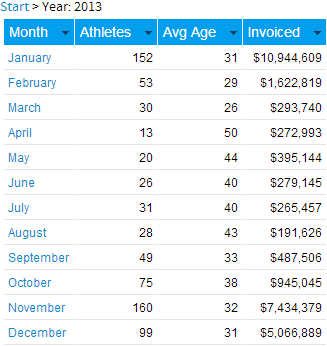
Each time you drill down the value that you selected becomes a filter for the next level down. You will not see all countries when drill down - just the countries for the region you selected.
For example you may be able to drill from
Year > Month > Date.
When you click on the link to the report will refresh with detail updated.
For example if your report contained region and you clicked on Europe the refreshed report will display all countries within Europe.
Initial Setup
When your administrator sets up your view they can define dimension hierarchies. These hierarchies are built to enable you to explore your data in a way that is appropriate for your business.
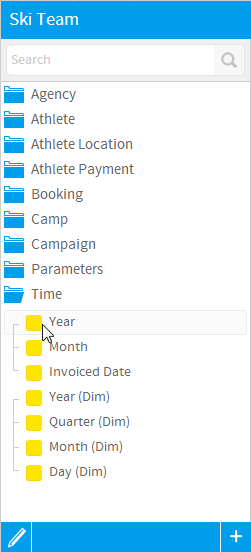
In the example above your administrator would have set the view up to build a time based hierarchy.
Year drills to > Month drills to > Date
Having done this Yellowfin re-calculates your report data as you move down the hierarchy.
The common areas for which hierarchies are created include:
- Geography (Region, Country, State)
- Date (Year, Quarter, Month, Week, Date).
- Organisation Structure (Division, Line of Business, Cost Centre)
- Customer (Country of Origin, Region, City, Customer).
- Product (Category, Line, Product Code)
See Drill Down Hierarchies for more information.
Using Drill Down
Analysis Style
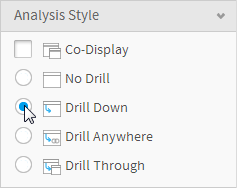
There are four Analysis Styles; Drill Down, Drill Anywhere, Drill Through, and Co-Display. The Drill styles cannot be used simultaneously used on a report as the user action looks similar and this could lead to confusion for a user that has not created the report.
To select the type of analysis you wish to apply click the Drill Down radio button on the Analysis Style panel of the Data step.
Add Drill Fields to your Report
- Locate the fields that you wish to add to your report. All fields that are drill able will be identifiable by the line which joins them in the report field's box.
- Select the level of the hierarchy that you wish to start your analysis from, generally this is the top level.
Note: you cannot add multiple fields from the same hierarchy onto a report - for example you cannot add Region and Country on the same report when using drill down - since you can drill from region to country.
Drill on Multiple Hierarchies
You can add in data from multiple hierarchies to assist your report readers to drill down and across various hierarchies such as product and organisation hierarchies.
When adding in multiple hierarchies it is suggested to use a Crosstab report so that the data is presented in a way that is easier to read and understand.
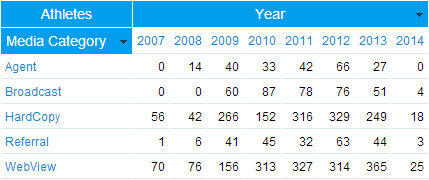
In the example below you can drill down on either the Year or Booking Method.
Drilling Up
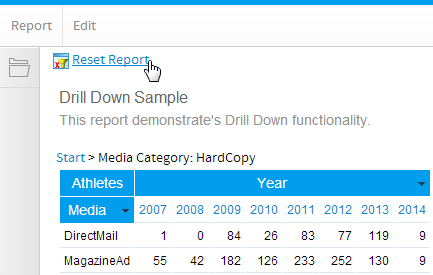
When you run a report with drill down each time you drill into a level of detail the report is refreshed with new data. To drill up to the level you were previously at, for example from Media back to Media Category, use the breadcrumb located at the top of the table or chart.
Reset Report
If you have multiple drill down options or you have drilled down multiple levels of a hierarchy you can easily reset your report. This will display the data as it was before you began your drill down analysis.
To reset a report you can either click the Reset Report link located under the main navigation bar, or the Start link on the drill breadcrumb.
Drilling on Charts
Just as with tables you can also drill down on charts.
- Place your cursor over the value you wish to drill on.
- Click the area of the chart
- The chart will be refreshed with new data.
Printing & Exporting Drill Results
You can print or export data from your report as a PDF or CSV file whilst drilling down to maintain a copy of the results of your analysis. Whenever you print or export your report the data as displayed on the screen will be printed or exported.

