Page History
...
| Table of Contents | ||
|---|---|---|
|
...
概要
| Styleclass | ||
|---|---|---|
| ||
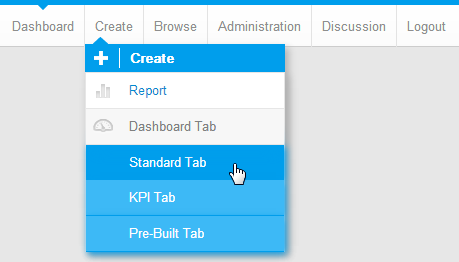
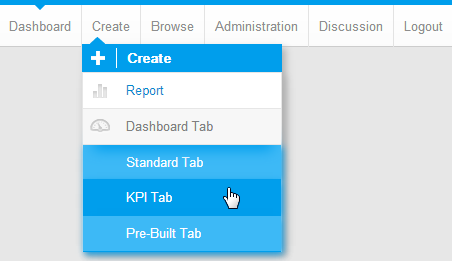
There are three types of tab available in Yellowfin; Standard, KPI, and Pre-Built.
Tab Type | Description |
|---|---|
Standard | These tabs have the broadest range of functionality available to them, including linked filters and series. The only reason you would not use a Standard Tab when creating a new tab is if you wanted to include a KPI Report on the tab. |
KPI | This tab type is only used if you want to include KPI Reports on your tab. The reason this is a seperate type is that some functionality is incompatible with KPI Reports, so the tab disables things like filters and linked series. |
Pre-Built | This is a tab that has been created by a user and is not currently displayed on your dashboard. This does not involve creating a new tab, just selecting an existing one to display. |
Yellowfinで使用できるタブには、標準、KPI、既存という3種類があります。
タブのタイプ | 説明 |
|---|---|
普通 | リンク済みのフィルターやシリーズなど、使用できる機能が最も広範です。タブにKPIレポートを含める場合のみ、新しいタブを作成するときに標準タブを使用しないでください。リンク済みのフィルターやシリーズなど、使用できる機能が最も広範です。タブにKPIレポートを含める場合のみ、新しいタブを作成するときに標準タブを使用しないでください。 |
KPI | タブにKPIレポートを含める場合のみ使用します。別のタイプとして用意されている理由は、一部の機能がKPIレポートと互換性がないためです。このタイプでは、フィルターやリンク済みシリーズなどの機能が無効になります。 |
既存 | ユーザーによって作成され、ダッシュボードには現在表示されないタブです。新しいタブを作成する必要はなく、既存のタブを選択して表示することができます。 |
既存のタブの追加
...
| Styleclass | ||
|---|---|---|
| ||
- To add a pre-built public tab, click Create in the main navigation bar, select Dashboard Tab and choose the Pre-built Tab option.
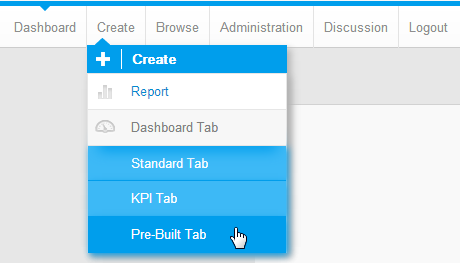
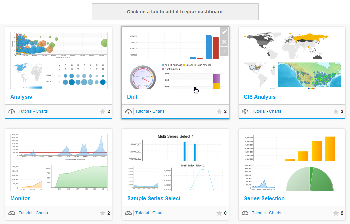
- You will now see a list of tabs available to you, similar to the Thumbnail view of the Browse page. Click on the tab you wish to add.
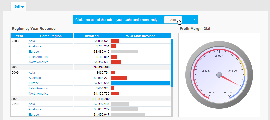
- On selecting a tab you will be returned to the Dashboard and shown a preview of the tab. To confirm you wish to add the tab to your dashboard, click the link at the top.
- You will now have added the tab to your Dashboard.
Note: you can only have one instance of a public tab on your dashboard.
...
- 既存の共有タブを追加するには、メインナビゲーションバーの「作成」をクリックし、「ダッシュボードタブ」を選択してから「既存のタブ」オプションを選択します。
- 使用可能なタブの一覧が表示されます。これは、閲覧ページのサムネイル表示に似ています。追加するタブをクリックします。
- タブを選択すると、ダッシュボードに戻り、タブのプレビューが表示されます。ダッシュボードにタブを追加することを確認するには、上部のリンクをクリックします。
- これで、タブがダッシュボードに追加されました。
注意: ダッシュボードに複数の共有タブを追加することはできません。
標準タブの作成
| Styleclass | ||
|---|---|---|
| ||
- To build a Standard Tab, click Create in the main navigation bar, select Dashboard Tab and choose the Standard Tab option.
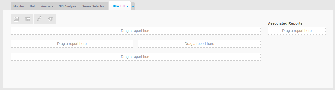
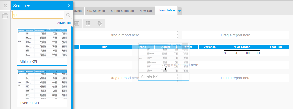
- You will now see an empty Tab Layout display. From here you will need to locate the reports you wish to display on the tab and drag them onto the template.
Open the Report List panel on the left of the screen.
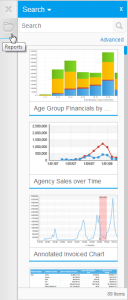
- Locate the Reports you wish to display on your tab and drag them into one of the 'Drag a report here' place holders.
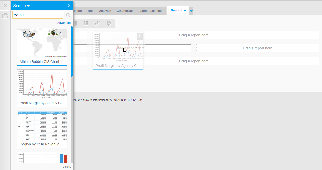
- Add all the reports you wish to display, then close the Report List panel by clicking on the X in the top right corner. You will now see your reports displayed in the layout template.
Tab Customisation
From here you are able do several things:
- Adjust the size and display of your reports.
See Report Portlet for more information.
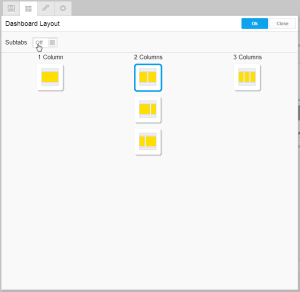
- Adjust the layout template of the tab.
See Dashboard Layout for more information.
- Create Sub Tabs as part of the tab.
See Creating Sub Tabs for more information.
- Create Analytic Links on the tab.
See Analytic Setup for more information.
- Link Series Selection on the tab.
See Series Selection Setup for more information.
...
- 標準タブを追加するには、メインナビゲーションバーの「作成」をクリックし、「ダッシュボードタブ」を選択してから「標準タブ」オプションを選択します。
- 空のタブレイアウト表示が表示されます。ここから、タブに表示するレポートを特定して、テンプレートにドラッグする必要があります。
画面左側の「レポート一覧」パネルを開きます。
- タブに表示するレポートを特定し、いずれかの「ここにレポートをドラッグ」プレースホルダーにドラッグします。
- 表示するすべてのレポートを追加したら、右上隅の「X」をクリックして「レポート一覧」パネルを閉じます。レイアウトテンプレートにレポートが表示されます。
タブのカスタマイズ
ここからいくつかの操作を実行できます。
- レポートのサイズおよび表示を調整します。
詳細については、レポートポートレット を参照してください。
- タブのレイアウトテンプレートを調整します。
詳細については、ダッシュボードレイアウト を参照してください。
- タブの一部としてサブタブを作成します。
詳細については、サブタブを作成 を参照してください。
- タブで分析のリンクを作成します。
詳細については、分析設定 を参照してください。
- タブでシリーズ選択をリンクします。
詳細については、シリーズ選択の設定 を参照してください。
KPIタブの作成
| Styleclass | ||
|---|---|---|
| ||
This requires the same process as creating a Standard Tab, with two differences:
- Select KPI Tab from the Create Dashboard Tab menu
- Drag KPI Formatted tabs into the KPI Report panel in the tab. Standard reports can still be added to all the Drag a report here panels.
...
標準タブを作成する場合と同じプロセスですが、異なる点が2つあります。
- 「作成」ダッシュボードタブメニューから「KPIタブ」を選択します。
- タブのKPIレポートパネルにKPI形式のタブをドラッグします。標準レポートも、すべての「ここにレポートをドラッグ」パネルに追加することができます。
サブタブの作成
| Styleclass | ||
|---|---|---|
| ||
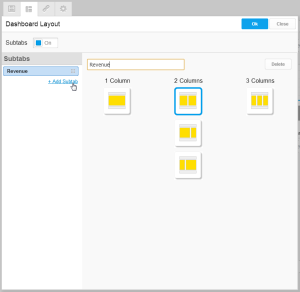
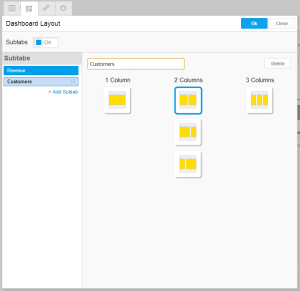
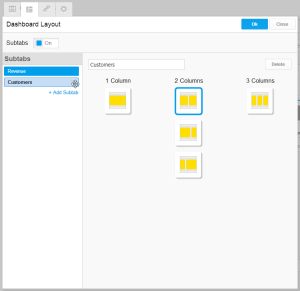
Sub Tabs allow you to split the content of a tab across multiple layouts, while still sharing the same filter sets.
サブタブを使用すると、同じフィルターセットを共有したまま、タブのコンテンツを複数のレイアウトに分割することができます。
- 「ダッシュボードレイアウト」メニューを開き、「サブタブ」を有効にします。
- 「+ サブタブ追加」をクリックして新しいサブタブを作成します。
- サブタブの名前とレイアウトオプションを指定します。
- 必要に応じて、左側の一覧でサブタブをドラッグしてサブタブを並べかえます。
- Open the Dashboard Layout menu and enable Sub Tabs
- Click the + Add Subtab link to create new sub tabs
- Provide a name and layout option for the sub tab
- Reorder the sub tabs if required by dragging them in the list on the left
| horizontalrule |
|---|
| Styleclass | ||
|---|---|---|
| ||