Page History
...
| Table of Contents | ||
|---|---|---|
|
...
概要
| Styleclass | ||
|---|---|---|
| ||
Yellowfin is an easy-to-use report writer for non-technical users, delivering drag-and-drop simplicity for formatting and data selection.
...
Yellowfinは、ドラッグ&ドロップインターフェースを備え、コンピュータの知識のないユーザーでも簡単にご利用になれるソフトウェアです。
データはどこから?
| Styleclass | ||
|---|---|---|
| ||
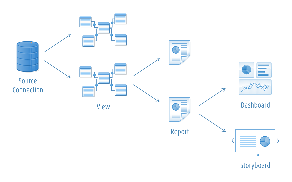
Yellowfin connects to your data through a Source Connection which is set up by an Administrator. From here, Advanced Users design and create Views which are meta-data layers used to specify relationships in the database and field availablitiy.
Views provide the Report Writer with fields to build their reports, without the need to understand all the technical aspects of database relationships. The Report Writer is then free to build content through the drag and drop interface.
When a user runs a Report, it uses logic defined in the View, and connects to a database via the Source Connection in order to return results.
...
Yellowfinでは、管理者が設定したソース接続によってデータに接続します。上級ユーザーはこれらのデータからビューを設計および作成します。ビューは、データベースでの関係とフィールドの可用性を指定するために使用される、メタデータレイヤーです。
ビューにより提供されるフィールドを使用すれば、レポート作成者は、データベースの関係を技術的にすべて理解していなくてもレポートを作成できます。また、レポート作成者は、インターフェースをドラッグ&ドロップして、コンテンツを自由に作成できます。
ユーザーがレポートを実行すると、レポートはビューで定義されたロジックを使用し、ソース接続を使用してデータベースに接続して、結果を返します。
レポートで実行できること
| Styleclass | ||
|---|---|---|
| ||
Using Yellowfin, a Report Writer can create many different types of reports. These vary from basic tabular reports, charts, and KPIs, to advanced geographical maps and reports that can combine results from multiple sources.
Some of the functionality available in reports includes:
- Drill - reports can move from a high level overview of data down to transaction level detail based on user interaction.
- Alerts - reports can contain highlighting based on rules defined by a Report Writer in order to draw the user's attention to a value.
- Calculations - reports can contain basic to highly complex calculations which can be defined in the View or Report.
- Filters - reports can restrict results returned through the use of filters either defined by the Report Writer or the Report Reader.
- Charts - reports can contain a wide range of visualisations defined through the Report Builder which allow users to view data outside of a tabular format.
- KPI & Summary - reports can contain KPI or Summary displays which allow users to quickly assess values important to them, before exploring in further detail.
...
レポート作成者はYellowfinを使用してさまざまなタイプのレポートを作成できます。レポートのタイプには、基本的なテーブル形式レポート、グラフ、およびKPIから、高度な地図や複数ソースの結果を組み合わせることができるレポートまであります。
レポートでは以下のような機能を使用できます:
- ドリルダウン- 画面操作により、高レベルのデータの概要から取引別の詳細までレポート内を移動できます。
- アラート- レポートでは、レポート作成者が定義したルールに基づいて強調表示することによって、ユーザーの注意を値に向けることができます。
- 計算- レポートには基本的な計算から非常に複雑な計算まで含めることができます。計算は「ビュー」または「レポート」で定義できます。
- フィルター- フィルター - レポートでは、Report WriterまたはReport Readerが定義したフィルターを使用して、返される結果を制限できます。
- グラフ - レポートには、レポートビルダーで定義した広範なグラフを含めることができます。これにより、ユーザーはテーブル形式以外でデータを表示できます。
- KPI &サマリー - レポートには、重要な値に迅速にアクセスできるKPIまたはサマリーを含めることができます。ユーザーはそこからさらに詳しく調べることができます。
はじめに
| Styleclass | ||
|---|---|---|
| ||
はじめに ページに移動して、Yellowfinの使用を開始してください。 Continue to the Getting Started page to begin using Yellowfin.
| horizontalrule |
|---|
| Styleclass | ||
|---|---|---|
| ||