30日間の無料評価版をお試しいただけます。

Versions Compared

Key

  • This line was added.
  • This line was removed.
  • Formatting was changed.

Anchor
top
top

Table of Contents
classcontents

Getting Started

Styleclass
ClasstopLink

...

KPI Tab

There are three different types of KPI Report available in Yellowfin:

...

You will need to create at least one of these before attempting this tutorial.

See KPI Report Tutorial for more information.
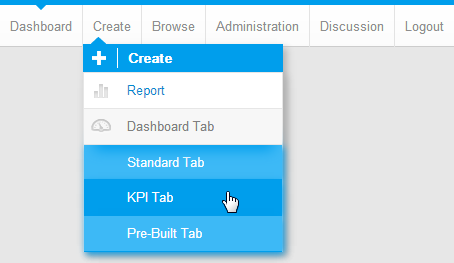
Creating a KPI Tab

Styleclass
ClasstopLink

...

KPI Tab

Section
Column
width30%

1. Now that you have created a KPI Report, you can create a KPI Tab. Click on the Add Tab link and select the KPI Tab option. This will bring up a blank tab, ready for reports to be added.

Column
width70%

...

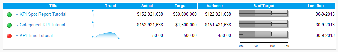
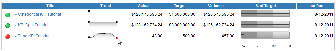
Reading and using the KPI Tab

Styleclass
ClasstopLink

...

KPI Tab

Section
Column
width30%

Now that you have a finished KPI Tab and Report it's time to learn what it all means.

1. Click on the next to the name of the KPI Report. This opens up the menu pictured.

2. From here you can reorder your KPI Reports (if you have more than one, and if the tab is in Edit mode) by clicking on the Move Up and Move Down options

3. You can view the original report by either clicking on the View Report option or clicking on the name of the report itself

4. You can select the Print option to generate a hard copy of the report

5. You can the Delete option to remove the report from the tab

Column
width70%

...

Section
Column
width30%

10. The % of Target is a Bullet Chart that helps visualise performance and lets you compare all metrics on an equal basis.

11. Finally, the Last Run field tells you when the report was refreshed.

12. You have now finished with KPI Tabs.

Column
width70%


horizontalrule
Styleclass
ClasstopLink

...

KPI Tab