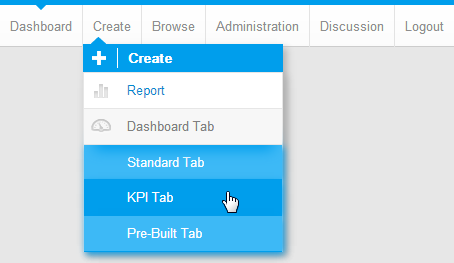
1. Now that you have created a KPI Report, you can create a KPI Tab. Click on the Add Tablink and select the KPI Tab option. This will bring up a blank tab, ready for reports to be added.
Column
width
70%
...
Section
Column
width
30%
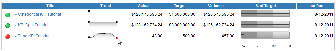
8. The Trend field is displayed using a Sparkline Graph. This compares the current version of the KPI report run with the previous version, indicates change and whether it is positive or negative.
Note:the sparkline only appears for the time KPI as this is using historical data. The other KPIs will generate a sparkline when they have run more than once.