Page History
...
| Table of Contents | ||
|---|---|---|
|
...
概要
| Styleclass | ||
|---|---|---|
| ||
レポートの「データ」ページでは、Yellowfinレポートを生成するために使用されるレポートデータ定義の作成、編集、および表示を行います。この設定にはレポートに使うデータを検索するためのクエリーと、そのデータをどう表示するかの書式が含まれます。The Report Data page is where you build, edit and view the report data definitions used to generate Yellowfin reports. These definitions include both the queries you use to retrieve data for your document, and the data formatting.
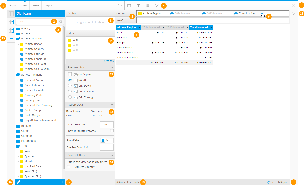
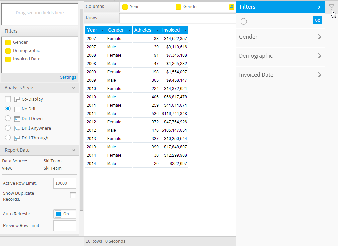
# | Function 機能/Panelパネル | Description 説明 | |
|---|---|---|---|
1. | ナビゲーション | Navigation | ナビゲーションバーのリンクをクリックして、ビルダーのさまざまなステップにアクセスします。 レポート リンクを使用すれば、最終ステップまで待たなくても、作成プロセス中にいつでも保存することができます。 Access various builder steps by clicking on the links in the navigation bar. The Report link provides the user with save options throughout the building process, rather than waiting until the final step. |
2. | View Fields Search | ビューフィールドの検索 | ここでは、レポートで使用するフィールドを検索し、ビルダーの前のステップである「作成」で選択したビューで指定されているすべてのフィールドにアクセスします。 Search for fields to use in the report here, accessing all fields provided by the selected View in the previous Create step of the builder. |
3. | View Fields List | ビューフィールド一覧 | ビルダーの前のステップである「作成」で選択したビューで指定されている一覧から、レポートで使用するフィールドを選択します。一度に複数のフィールドを追加するには、Ctrl/CommandまたはShiftキーを押したままフィールドを選択するだけです。 Select fields to use in the report from the list provided by the selected View in the previous Create step of the builder. To add multiple fields at once, simply hold down Ctrl/Command or Shift while selecting fields. |
4. | Formatting Menus | 書式メニュー | ナビゲーションバーのこの部分から、さまざまな書式メニューを使用できます。これにより、ユーザーは、「データ」ステップと「表示」ステップを切り替えることなく、「データ」ステップだけで書式変更をレポートに適用したり、表示をプレビューしたりすることができます。
Access various formatting menus from this section of the navigation bar. This allows the user to apply formatting changes to the report and preview the output while still on the Data step, rather than having to toggle between it and the Output step.
|
5. | Table Body Fields | 表の内容に関するフィールド | カラムとロウの一覧にフィールドをドラッグして、レポートの内容を作成します。両方の一覧にフィールドを追加すると、自動的にクロス集計レポートが作成されます。
Drag fields into the Columns and/or Rows lists to build the body of the report. Adding fields to both lists will create a cross tab report automatically.
|
6. | Field Drop Down Menus | フィールドドロップダウンメニュー | このドロップダウンメニューから、集計、書式、高度な関数、合計、およびその他のオプションをフィールドに適用します。 Apply aggregations, formatting, advanced functions, totals, and other options to a field via its drop down menu. |
7. | Table Preview | 表のプレビュー | 最終的なレポート表示のプレビューを表示します。表にフィールドを追加する場合、カラムやロウの一覧にフィールドを追加する代わりに、このプレビュー領域にフィールドをドラッグすることもできます。また、フィールドヘッダーを適切な位置にドラッグしてフィールドの順序を変更することもできます。
View a preview of the final report output. The user can also drag fields into this preview area, rather than adding them to the Columns or Rows list to add them to the table. Fields can also be reordered here by dragging the field headers into position.
|
8. | Section Fields | セクションフィールド | レポートでセクションとして使用するフィールドを選択すると、セクションフィールドのそれぞれの値について、表内に分割が作成されます。
Select fields to be used as sections in the report, these will create splits in the table for each value of the section field(s).
|
9. | Filter Fields | フィルターフィールド | レポートでフィルターとして使用するフィールドを選択します。これらのフィールドの値は、レポートの作成プロセス中に定義するか、またはユーザープロンプトのままにすることができます。
Select fields to be used as filters in the report, values for these can either be defined during the report creation process, or left as user prompt.
|
10. | Close Builder Button | ビルダーを閉じるボタン | このボタンを使用してビルダーを終了します。 Leave the builder using this button. |
11. | Filter Panel | フィルターパネル | ここで、表のプレビューにおける結果を制限するために、ユーザープロンプトとして定義されたフィルターに値を適用します。ここで適用された値はプレビューの調整にのみ使用され、最終的なレポート表示の調整には使用されません。
Apply values to filters defined as user prompt here in order to restrict the results in the table preview. Values applied here are only used to adjust the preview, not the final report output.
|
12. | Analysis Style | 分析スタイル | このパネルから、関連するレポートおよびドリルの機能を有効化します。
Enable Related Reports and Drill functionality through this panel.
|
13. | Report Data | レポートデータ | レポート作成時のベースとなるデータソースおよびビュー名を表示します。フィールドの変更のたびに頻繁にデータベースにクエリーを送信するのではなく、ダミーデータを使用してレポートを作成する場合、ユーザーは、レポート(プレビュー)で返されるロウ(行)を制限し、「自動更新」をオフにすることもできます。
View the Data Source and View name that the report is built on. The user can also limit the rows returned in the report, the preview, and switch the Auto Refresh off if they wish to build with dummy data, rather than continually querying the database after each field change.
|
14. | Source Filters | ソースフィルター | レポート作成用に選択されたビューにソースフィルターが適用されている場合は、ここにソースフィルターが表示され、有効化または無効化することができます。ユーザーに「アクセスフィルター」ロール権限がない場合、このセクションは表示されません。
If there are source filters applied to the View selected to build off, they will appear here to be enabled/disabled. If the user does not have the Access Filter role permission they will not see this section.
|
15. | Sub Query Panel | サブクエリーパネル | このパネルから、サブクエリーを作成したり、サブクエリー間を切り替えたりします。ユーザーに「サブクエリー」ロール権限がない場合、これらのボタンは表示されません。
Create and switch between sub queries through this panel. If the user does not have the Sub Queries role permission they will not see these buttons.
|
16. | Edit View | ビューの編集 | ユーザーは、レポート作成に必要な変更を行うために、このボタンからビューにアクセスすることができます。ユーザーに適切な「データベースビュー」ロール権限がない場合、このボタンを使用することはできません。 The user can access the view via this button in order to make changes required for the report creation. If the user does not have the appropriate Database Views role permissions they will not have access to this button. |
17. | Add Calculation | 計算の追加 | ユーザーは、レポート内で使用する計算フィールドを作成することができます。ユーザーのロール権限によっては、フリーハンドSQL計算式の作成やビルダーインターフェースの使用が可能です。
The user can create calculated fields to use within the report. Depending on the user's role permissions they may be able to create Freehand SQL calculations as well as using the builder interface.
|
18. | Table Preview Info | 表のプレビュー情報 | データ件数と、表のプレビューを返すのにかかった時間を表示します。
View the number of rows and time taken to return the table preview.
|
19. | Refresh Report | Refresh the data displayed in the table preview.
|
...
レポートの更新 | 表のプレビューに表示されるデータを更新します。
|
レポートデータ
| Styleclass | ||
|---|---|---|
| ||
The Report Data panel displays information related to the source of the report, and settings that can be applied to the rows and preview.
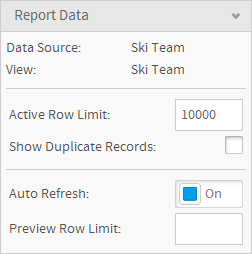
- Data Source - provides the name of the db connection used to create the report.
- View - provides the name of the view use to create the report.
- Active Row Limit - provides the user with the option to restrict the number of rows returned in the active report. This is inherited from the Source Connection, but can be restricted further at the report level.
Note: this setting does not control the table preview on the data step, only the final output of the report. - Show Duplicate Records - this allows the user to remove the 'DISTINCT' clause from the SQL. This means that results that appear multiple times will display in the final report, rather than being removed, so there may be rows that are identical.
- Auto Refresh - this allows the user to turn the Auto Refresh option On or Off. Auto Refresh controls the way the sample data in the Table Preview is generated.
- On - each time a change is made to the report, such as a field being added to the Columns or Rows list, the database is queried.
- Off - dummy data is used to display a preview of the table without querying the database. This should be used for reports that require a large number of fields to be added, or edits made, to help with performance.
Note: this setting does not control the final output of the report, only table preview on the data step.
- Preview Row Limit - this allows the user to define the number of rows displayed in the table preview.
Note: this setting does not control the final output of the report, only table preview on the data step.
...
「レポートデータ」パネルには、レポートのソースに関連する情報およびロウ(行)やプレビューに適用可能な設定が表示されます。
オプション | 説明 |
|---|---|
データソース | レポートの作成に使用されるデータベース接続名が表示されます。 |
ビュー | レポートの作成に使用されるビュー名が表示されます。 |
有効なロウ(行)数の制限 | ユーザーに有効なレポートで返されるロウ(行)数を制限するオプションが提供されます。このオプションはソース接続から継承されますが、レポートレベルでさらに制限することができます。 |
重複レコードを表示 | このオプションを使用すると、ユーザーはSQLからDISTINCT節を削除することができます。つまり、複数回出現する結果は削除されずに最終的なレポートに表示されることになるため、同一のロウ(行)が表示される可能性があります。 |
自動更新 | このオプションを使用すると、ユーザーは「自動更新」オプションを「オン」または「オフ」にすることができます。「自動更新」では、表のプレビューにおけるサンプルデータの生成方法が制御されます。
|
プレビューのロウ(行)数制限 | このオプションを使用すると、ユーザーは、表のプレビューに表示されるロウ(行)数を定義することができます。 |
表のプレビュー
| Styleclass | ||
|---|---|---|
| ||
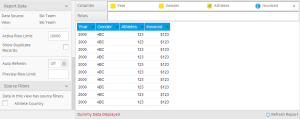
The Table Preview provides the user with a snapshot of what the report will look like, with a limited number of rows and the option to use dummy data.
Dummy Data
You can see here that the system has generated mock data in order to populate the report to preview the layout and format. The user has the option to manually refresh the data using the Refresh Report setting in the bottom right of the page.
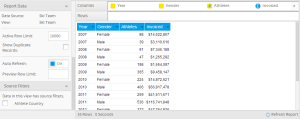
Real Data
You can see here that real data has been used by querying the database. The number of rows returned and the time the query too is displayed in the bottom left corner of the preview panel.
...
レポートがどのように表示されるかがスナップショットで示されます。表のプレビューで表示されるロウ(行)数は制限されており、オプションでダミーデータを使用することもできます。
ダミーデータ
以下の図では、レポートにデータを投入してレイアウトと書式のプレビューを表示するために、システムによりモックデータが生成されています。ユーザーは、ページの右下にある「レポートの更新」設定を使用して、データを手動で更新することができます。
実際のデータ
以下の図では、データベースにクエリーを送信することにより、実際のデータが使用されて表示されています。プレビューパネルの左下隅に、返されたロウ(行)数と、クエリーにかかった時間も表示されます。
フィルターのプレビュー
| Styleclass | ||
|---|---|---|
| ||
Once fields have been added to the Filters list on the Data step you will see a filter panel on the right of the page become available. This works as filters do on the Dashboard and Report Output pages and is designed to allow users to preview how certain filter values may effect the table preview.
Note: this does not define filter settings or values for the active report output, only for the table preview on the data step of the builder.
...
「データ」ステップの「フィルター」一覧にフィールドが追加されると、ページの右側にあるフィルターパネルが使用可能になります。このフィルターパネルは、「ダッシュボード」ページや「レポート表示」ページでのフィルターのように機能し、特定のフィルター値が表のプレビューに与える影響をプレビューすることができるように設計されています。
注意:ここで定義されるのはビルダーの「データ」ステップでの表のプレビューを対象としたフィルター設定や値のみであり、有効なレポート表示の設定や値は定義されません。
ソースフィルター
| Styleclass | ||
|---|---|---|
| ||
If there are Source Filters available in the report's view they will be available to enable/disable here. The user must have the required role permissions in order to see these settings as they are used for row level security.
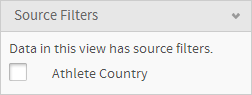
レポートに表示される結果をそれぞれのユーザーにユニークなものにするためにはソースフィルターを使用します。表示されるデータをその閲覧者の個人的なものにすることが可能です。
レポートのビューで使用可能なソースフィルターが存在する場合、ここで有効化または無効化することができます。これらの設定はロウレベルのセキュリティに使用されるため、表示するためにはユーザーに必要なロール権限がなくてはなりません。
詳細については、 ソースアクセスフィルター を参照してください。See Source Access Filters for more information.
| horizontalrule |
|---|
| Styleclass | ||
|---|---|---|
| ||