Page History
...
| Table of Contents | ||
|---|---|---|
|
...
概要
| Styleclass | ||
|---|---|---|
| ||
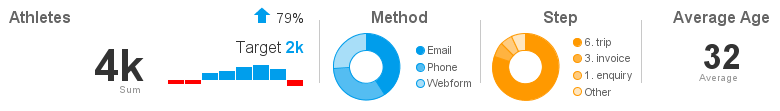
Report Summaries allow the user to build summary level KPI and chart displays into their report. This allows for a row of summary information to be displayed along with a very detailed report, providing to levels of analysis.
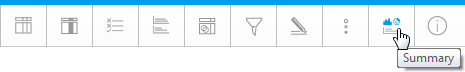
In order to create a Report Summary you will need to be on the Output step of the Report Builder, while it's in draft mode. From here you will find a Summary button on the main formatting toolbar.
Exceptions
Report Summaries cannot be used in the following cases:
- Drill Down Reports (the summary will display before the report has been drilled into)
- Drill Anywhere Reports (the summary will display before the report has been drilled into)
- Section Reports
- KPI Reports
- Visible Series Selection Charts
- Time Series Charts with Date Sliders
レポートのサマリーでは、サマリーレベルのKPIおよびグラフ表示をレポートに組み込むことができます。サマリー情報の行が非常に詳細なレポートと共に表示されるため、さまざまなレベルで分析することができます。
レポートサマリーは、ドラフト(編集中)モードのときにレポートビルダーの「表示」ステップで作成する必要があります。ここには、メインの書式設定ツールバーに「サマリー」ボタンがあります。
例外
次の場合は、レポートのサマリーを使用できません。
- ドリルダウンレポート(サマリーは、レポートがドリルダウンする前に表示されます)
- ドリルエニウェアレポート(サマリーは、レポートがドリルダウンする前に表示されます)
- セクションレポート
- KPIレポート
- シリーズ選択の表示グラフ
- タイムシリーズグラフ(日付スライダーあり)
プレビュー
...
| Styleclass | ||
|---|---|---|
| ||
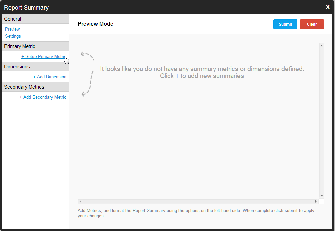
When you first start building your Report Summary, you will be taken to the following lightbox:
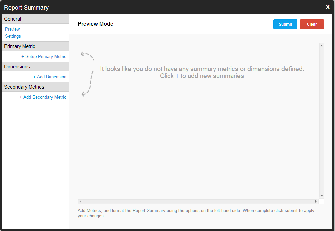
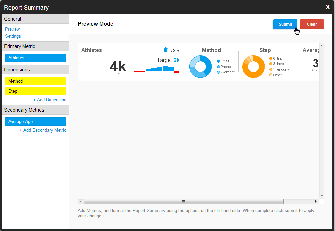
Here you are shown all the building options down the left of the page, with the preview pane on the right currently empty. As soon as you build summary content you will see a preview, as below.
...
レポートサマリーを作成し始めるときは、次のライトボックスが表示されます。
ページの左側にはすべての作成オプションが並んでいて、右側のプレビューペインはこの時点では空の状態になっています。サマリーコンテンツを作成すると、すぐに次のようなプレビューが表示されます。
設定
| Styleclass | ||
|---|---|---|
| ||
ビルダー左側の「設定」オプションをクリックして、レポートサマリーの見た目や使い方をカスタマイズすることができます。You can customise the appearance and use of the Report Summary by clicking on the Settings option on the left of the builder.
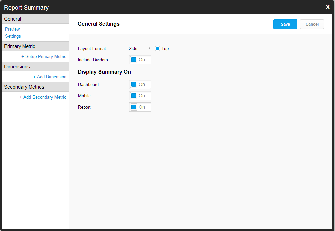
設定 Setting | オプション Options | 説明 Description |
|---|---|---|
レイアウトの書式 Layout Format | Side 「横」/ Top | Display the summary either at the top or side of the chart. If the report is table only the display will always be 'top'. |
Include Dividers | Off / On | Display dividers between each of the elements in the Report Summary (Primary Metric, Dimensions, Secondary Metrics). |
Dashboard | Off / On | Make the Report Summary available for display on the Dashboard. You will still need to enable it when creating the Dashboard Tab. |
Mobile | Off / On | Make the Report Summary available for display on mobile devices. |
Report | Off / On | Make the Report Summary available for display on the Report Preview page (away from the dashboard). |
...
「トップ」 | サマリーをグラフの上または横に表示します。レポートがテーブルのみの場合、表示は常に「上」になります。 | |
仕切りを含める | 「オフ」/「オン」 | レポートサマリーのエレメント間(「プライマリメトリック(数値)」、「ディメンション(次元)」、「セカンダリメトリック(数値)」)に区切り線を表示します。 |
ダッシュボード | 「オフ」/「オン」 | レポートサマリーをダッシュボードで表示できるようにします。ダッシュボードタブを作成するときは、手動で有効にする必要があります。 |
モバイル | 「オフ」/「オン」 | レポートサマリーをモバイルデバイスで表示できるようにします。 |
レポート | 「オフ」/「オン」 | レポートサマリーを(ダッシュボードからは離れて)「レポートプレビュー」ページで表示できるようにします。 |
プライマリメトリック
| Styleclass | ||
|---|---|---|
| ||
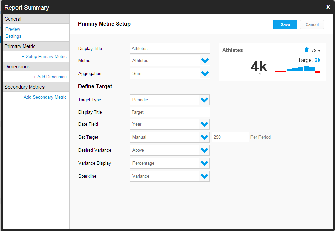
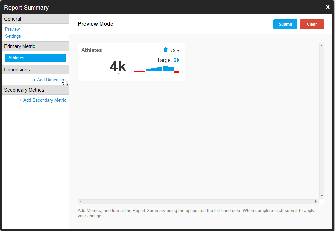
The first thing you need to do, when creating your Report Summary, is define the Primary Metric of the report. This is the main measurement in the report.
- Click on the + Setup Primary Metric link on the left hand side of the builder.
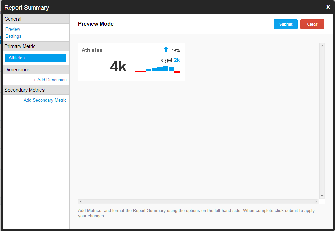
- Define the options used to build the summary display. Depending on the Target Type settings you select, you may not have all of the options listed here. Once populated, the builder will display a preview of the summary on the top right of the screen.
Option
Possible Values
Description
Display Title
Text Entry
Provide a label to be used in the Report Summary. This does not have to be the same as the Column Name.
Metric
Metric fields
Select the metric field you wish to assign as the Primary Metric.
Aggregation
% Change, Average, Change, Count, Count Distinct, Maximum, Minimum, Sum
Select the aggregation you wish to apply to the metric. The Summary is going to look at this figure as a whole, not split by any categories, so it's important to select the correct aggregation.
Target Type
None, Periodic, Total
If you wish to compare your Primary Metric value to that of a target or budget, define here.
Display Title
Text Entry
Provide a label to be used in the Report Summary for the target.
Date Field
Date field
If you have selected a Periodic Target you will need to select a date field to define the periods.
Set Target
Manual or Metric fields
Define the Target as a field, or a user defined value
Desired Variance
Above, Below, Range
Define where you want the variance to fall. For example, do you want your metric to be above the target?
Variance Display
None, Actual, Percentage
Select the display of the variance.
Sparkline
None, Actual, Variance
Select the display of the variance for each period.
- Click Save to keep your selections and continue building your Report Summary.
...
レポートサマリーを作成するときに最初に実行することは、レポートのプライマリメトリックを定義することです。これがレポートでメインの測定になります。
- ビルダー左側にある「+ プライマリメトリック設定」リンクをクリックします。
- サマリー表示を作成するときに使用するオプションを定義します。選択した「目標タイプ」設定によっては、ここに示すすべてのオプションが表示されないことがあります。
オプション
可能な値
説明
表示タイトル
テキスト入力
レポートサマリーで使用するラベルを指定します。これは、カラム名と同じである必要はありません。
メトリック(数値)
メトリックフィールド
プライマリメトリックとして割り当てるメトリックフィールドを選択します。
集計
「変化率(% Change)」、「平均」、「差異」、「個数」、「重複を除いたデータの個数」、「最大」、「最小」、「合計」
メトリックに適用する集計を選択します。サマリーではこの図表をカテゴリーに分割せず全体として見るため、正しい集計を選択することが重要です。
目標タイプ
「なし」、「期間」、「合計」
プライマリメトリックの値を目標や予算の値と比較する場合は、ここで定義します。
表示タイトル
テキスト入力
目標のレポートサマリーで使用するラベルを指定します。
日付フィールド
日付フィールド
「期間」目標を選択した場合は、期間を定義するために日付フィールドを選択する必要があります。
目標設定
手動またはメトリックフィールド
目標をフィールドとして、またはユーザー定義の値として定義します。
望ましい差異
「上」、「下」、「範囲」
差異が収まる位置を定義します。たとえば、メトリックを目標よりも上にしますか?
差異表示
「なし」、「実績」、「パーセンテージ」
差異表示を選択します。
スパークライン
「なし」、「実績」、「差異」
各期間の差異表示を選択します。
- 設定されると、ビルダーの画面右上にサマリーのプレビューが表示されます。
- 「保存」をクリックして、選択内容を保持し、レポートサマリーの作成を続行します。
ディメンション(次元)
| Styleclass | ||
|---|---|---|
| ||
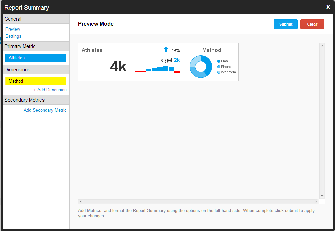
In order to provide categorical summaries you can define Dimensions for display in your Report Summary. These display a selected metric, split into categorical values by a dimension field, displayed on a donut chart.
- Click on the + Add Dimensions link on the left hand side of the builder.
- Define the options used to build the summary display. Once populated, the builder will display a preview of the summary on the top right of the screen.
Option
Possible Values
Description
Display Title
Text Entry
Provide a label to be used in the Report Summary.
Dimension
Dimension field
Select a dimension field from the report to use as the categories in the donut.
Metric
Metric field
Select a metric field from the report to use as the size of the segments in the donut.
Colour
HEX code
Define a colour to use in the donut - shades of this one colour will be applied to segments.
Max Segments
Text Entry
Define the number of segments displayed in the donut before the 'other' segment. As this is a summary chart 1-3 are recommended, not larger.

- Click Save top keep your selections and continue building your Report Summary.
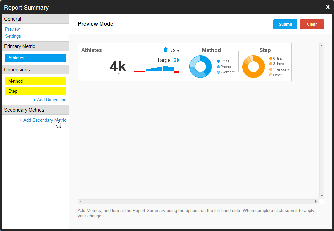
- You can add several dimensions if required.

...
カテゴリー別のサマリーを提供するために、レポートサマリーで表示するディメンション(次元)を定義することができます。これらには選択したメトリックが表示されます。選択したメトリックはディメンション(次元)フィールドでカテゴリー別の値に分割されて、ドーナツグラフに表示されます。
- ビルダー左側にある「+ ディメンション追加」リンクをクリックします。
- サマリー表示を作成するときに使用するオプションを定義します。
オプション
可能な値
説明
表示タイトル
テキスト入力
レポートサマリーで使用するラベルを指定します。
ディメンション(次元)
ディメンションフィールド
ドーナツのカテゴリーとして使用するディメンションフィールドをレポートから選択します。
メトリック(数値)
メトリックフィールド
ドーナツの範囲サイズとして使用するメトリックフィールドをレポートから選択します。
色
HEXコード
ドーナツで使用する色を定義します。この1色による色調がセグメントに適用されます。
最大セグメント数
テキスト入力
ドーナツで「その他」の範囲の前に表示される範囲の数を定義します。これはサマリーグラフであるため、1~3をお勧めします。大きい値は使用しないでください。
- 設定されると、ビルダーの画面右上にサマリーのプレビューが表示されます。
- 「保存」をクリックして、選択内容を保持し、レポートサマリーの作成を続行します。
- ここで、必要に応じていくつかのディメンション(次元)を追加できます。
セカンダリメトリック
| Styleclass | ||
|---|---|---|
| ||
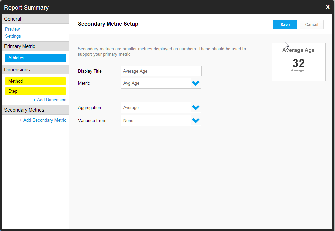
In order to provide additional metric information to the Report Summary you are able to define Secondary Metrics. These don't display as much information as the Primary Metric.
レポートサマリーに追加のメトリック情報を提供するために、セカンダリメトリックを定義できます。プライマリメトリックほど多くの情報は表示されません。
- ビルダー左側にある「+セカンダリメトリック追加」リンクをクリックします。
- サマリー表示を作成するときに使用するオプションを定義します。
オプション
可能な値
説明
表示タイトル
テキスト入力
レポートサマリーで使用するラベルを指定します。これは、カラム名と同じである必要はありません。
メトリック(数値)
メトリックフィールド
プライマリメトリックとして割り当てるメトリックフィールドを選択します。
集計
「変化率(% Change)」、「平均」、「差異」、「個数」、「重複を除いたデータの個数」、「最大」、「最小」、「合計」
メトリックに適用する集計を選択します。サマリーではこの図表をカテゴリーに分割せず全体として見るため、正しい集計を選択することが重要です。
差異の対象
「なし」またはメトリックフィールド
目標をフィールドとして定義するか、または目標を使用しません。
望ましい差異
「上」、「下」、「範囲」
目標を定義した場合に、差異が収まる位置を定義します。たとえば、メトリックを目標よりも上にしますか?
- 設定されると、ビルダーの画面右上にサマリーのプレビューが表示されます。
「保存」をクリックして、選択内容を保持し、レポートサマリーの作成を続行します。 - 「送信・実行」をクリックしてレポートサマリーを完了し、「レポートプレビュー」ページに戻ります。
- Click on the + Add Secondary Metric link on the left hand side of the builder
- Define the options used to build the summary display. Once populated, the builder will display a preview of the summary on the top right of the screen.
Option
Possible Values
Description
Display Title
Text Entry
Provide a label to be used in the Report Summary. This does not have to be the same as the Column Name.
Metric
Metric fields
Select the metric field you wish to assign as the Primary Metric.
Aggregation
% Change, Average, Change, Count, Count Distinct, Maximum, Minimum, Sum
Select the aggregation you wish to apply to the metric. The Summary is going to look at this figure as a whole, not split by any categories, so it's important to select the correct aggregation.
Variance From
None or Metric fields
Define the Target as a field, or don't use a target at all.
Desired Variance
Above, Below, Range
Define where you want the variance to fall if you've defined a target. For example, do you want your metric to be above the target?
Click Save to keep your selections and continue building your Report Summary. - Click Submit to complete your Report Summary and return to the Report Preview page.
| horizontalrule |
|---|
| Styleclass | ||
|---|---|---|
| ||