Page History
...
| Table of Contents | ||
|---|---|---|
|
...
Yellowfinコンポーネントの概要
| Styleclass | ||
|---|---|---|
| ||
Yellowfinは、ソース接続やビューなどのコンポーネントを可能な限り再利用するように設計されています。このモデルは、Yellowfin内でオブジェクトの階層を作成します。この階層を理解すると、チュートリアルの理解が深まります。Yellowfin is designed to reuse components, such as Source Connections and Views, as much as possible. This model creates a hierarchy of objects within Yellowfin and understanding this hierarchy will assist you with this tutorial.
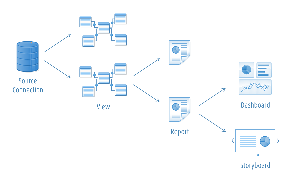
Source Connections | A source connection stores details of how Yellowfin will connect to an external database that you wish to report from. For every database that you wish to write reports for, you will have to create a single source connection record within Yellowfin. |
|---|---|
Views | Once you have defined a source connection you must create one or more view records that your users can report off. |
Reports | Once a view is defined you can write a report against it. A report record is a report definition which defines which columns in your database you want to display and how you want to display them. |
Dashboard Tabs | Once you have written reports, you can begin to construct your dashboard. You can place as many reports onto a tab as you wish. You can also create as many tabs as you wish on your own personal dashboard. |
Storyboard | Storyboard is a presentation layer in Yellowfin that allows users to create slide shows with fully functional reports as well as text, images, and videos. |
In this tutorial we will work sequentially through this hierarchy. First we will understand how connections to the database function, then create a view and then write reports before finally adding these reports to a new dashboard tab.
...
ソース接続 | する方法の詳細を保存します。レポートの作成元となるすべてのデータベースについて、Yellowfin内にソース接続レコードを1つ作成する必要があります。 |
|---|---|
ビュー | ソース接続を定義したら、ユーザーがレポートを作成できる1つまたは複数のビューレコードを作成する必要があります。 |
レポート | ビューを定義したら、そのビューに対するレポートを作成できます。レポートレコードは、データベース内の表示するカラム(列)およびその表示方法を定義するレポート定義です。 |
ダッシュボードタブ | レポートを作成したら、ダッシュボードの構成が可能になります。任意の必要な数のレポートを配置することができます。また、個人用のダッシュボードには、任意の必要な数のタブを作成できます。 |
ストーリーボード | ストーリーボードは、Yellowfinのプレゼンテーションレイヤーです。ユーザーはフル機能のレポートに加え、テキスト、イメージおよび動画を使用したスライドショーを作成できます。 |
このチュートリアルでは、この階層順に作業を進めます。はじめに、データベース機能への接続方法を理解し、次にビューを作成し、レポートを作成し、最後にこれらのレポートを新規ダッシュボードタブに追加します。
Ski Teamチュートリアルデータベース
| Styleclass | ||
|---|---|---|
| ||
The tutorial database used for this tutorial is the Ski Team database. This database is part of the Tutorial Content that you will need to choose to install along with Yellowfin. The data has been structured to provide a similar experience to that you may have had when reporting from many operational databases.
About Ski Team Database
Ski Team is a ski tourism business that organises ski trips in various locations around the world and markets these to its existing clients. The Ski Team database contains information relating to the core tourism business. It contains details of the camps run, the athletes who attended those camps, and campaigns associated with sourcing athletes. In addition it does contain financial information related to the amount invoiced and received for each client taking part in ski trips.
The data in this database will assist managers of Ski Team to understand the profitability of each of their programs, identify who their most profitable clients are and better manage their best performing camps.
Ski Team Tables used in this Tutorial
For the examples in this tutorial only four tables from the Ski Team database are used. These are:
Athlete Fact | This contains information about each athlete and their participation on a camp. In this database the person fact will generally have one record for each camp and each person for every year. The fact record is concerned about the individual trips for each program. |
Camp | This is a dimensional table which contains information about each camp. For example the name and location of the camp. Camp ID is the Key to this table. |
Person | The person table contains information about the athlete such as name and address details. Person ID is the Key to this table. |
Date Lookup | This table is used to create data hierarchies used for drill down purposes. Day Date is the Key to this table. |
In this tutorial we will use these tables to construct a view which centered on the customer. It will let us report the revenue generated by customer and overall performance of our ski programs.
About this Tutorial
このチュートリアルに使用するチュートリアルデータベースは、Ski Teamデータベースです。このデータベースは、インストールプロセスのステップ4でYellowfinと同時にインストールする、チュートリアルデータベースの一部です。データは、多くの実稼働データベースからレポートを作成したときと同様な体験を得られるように構造化されています。
Ski Teamデータベースについて
Ski Teamは、世界中のさまざまな場所へのスキー旅行を主催し、既存の顧客へのスキー旅行のマーケティングを行う観光企業です。Ski Teamデータベースには、基幹の観光ビジネスに関する情報が格納されています。このデータベースには、キャンプ運営、これらのキャンプに参加するアスリート、およびアスリートの募集に関連したキャンペーン詳細情報が含まれています。さらに、スキー旅行に参加した各顧客に対する請求額や受領額に関連した財務情報が含まれています。
このデータベース内の情報により、Ski Teamのマネージャーは同社の各プログラムの収益性をより詳細に理解できるようになり、最も収益が高い顧客を特定できるようになり、最適なキャンプ運営をより効率良く管理できるようになります。
Ski Teamコアテーブル
Ski Teamの例で使用する主要なテーブルは以下の通りです:
Athlete Fact | このテーブルには、各アスリートのキャンプへの参加状況の情報が含まれています。このデータベースでは、各キャンプおよび各個人に対応した1つのレコードが参加情報となり、これが年次に記録されています。このレコードは、各プログラムの個別の旅行を対象としています。 |
Camp | このテーブルは、各キャンプに関する情報を含む多次元テーブルです。たとえば、キャンプの名前、場所などの情報が含まれています。「Camp ID」がこのテーブルのキーとなります。 |
Person | 名前や詳細な住所など、アスリートの情報を含むテーブルです。「Person ID」がこのテーブルのキーとなります。 |
開始ステップ
| Styleclass | ||
|---|---|---|
| ||
This tutorial is made up of 5 steps:
Step | Description | Learn how to... |
|---|---|---|
1 |
| |
2 |
| |
3 |
| |
4 |
| |
5 |
|
ここでは、主に3つのトピックについて説明します:
| ステップ | 説明 |
|---|---|---|
1. | Yellowfinに最初にログインする方法について説明します。 | |
2. | Yellowfinシステムのさまざまなコンポーネントやビルダーにアクセスして移動する方法について説明します。 | |
3. | Yellowfinのさまざまなタイプのコンテンツにアクセスする方法について説明します。 |
これらの内容を理解したら、Wikiの コンテンツの作成 セクションに進みます。
| horizontalrule |
|---|
| Styleclass | ||
|---|---|---|
| ||