Page History
...
| Table of Contents | ||
|---|---|---|
|
...
概要
| Styleclass | ||
|---|---|---|
| ||
The Report Data page is where you build, edit and view the report data definitions used to generate Yellowfin reports. These definitions include both the queries you use to retrieve data for your document, and the data formatting.
You can easily add data to an empty report by dragging and dropping the report fields from the available data fields list.
- Navigation: The process step guide provides you with a visual display of the steps required in your report builder wizard. The number of steps displayed will vary based on some of your selections on this screen - for example if you choose to include a chart on the report.
- Search: The Search box allows you to quickly find a field for your report when instead of browsing through the categories.
- Data Fields: The Data Fields display provides you with a list of all available fields to add to your report from the selected view. Click on the folder expand image to open the folder and view all the fields within it.
- Calculations: You can create calculated columns that are unique for the current report.
- Source: The current data source and view name is displayed. Click on the view name to view a summary of the view.
- Resize: Used the drag icon to resize the Data Fields panel to make it easier to read the column names you wish to add to your report.
- Data: The report data section is used to specify which fields you wish to include in your report. Drag a field from the report field list and into the report column. The calculation buttons allow you to perform calculations on metrics included in your report.
- Filters: Filters allow you to specify which attributes should provide a filter such as date - only show events that have occurred today.
- Sections: The report section area allows you to create sections in your report based upon dimension data. An example may be that a new section is created based upon Business Unit.
- Report Options: The report options section provides you with advanced functions for manipulating the output of your report. Options include: Charts, Crosstab Display, Totals etc. Click on the expand image to open the various sections available to you.
Categories & Fields
| Styleclass | ||
|---|---|---|
| ||
The data fields section on the left hand side of the Report Data page provides you with a list of all possible fields that can be used in your report and grouped into useful categories. These fields relate back to the data in the database and in some cases have already had some manipulation occur to them - this is especially likely for metric type fields.
...
| Column | ||
|---|---|---|
| ||
...
| width | 90% |
|---|
...
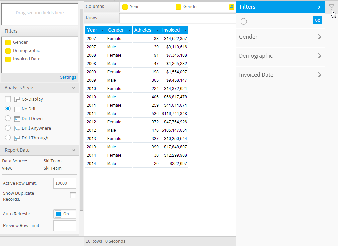
レポートの「データ」ページでは、Yellowfinレポートを生成するために使用されるレポートデータ定義の作成、編集、および表示を行います。この設定にはレポートに使うデータを検索するためのクエリーと、そのデータをどう表示するかの書式が含まれます。
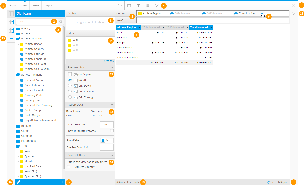
# | 機能/パネル | 説明 |
|---|---|---|
1. | ナビゲーション | ナビゲーションバーのリンクをクリックして、ビルダーのさまざまなステップにアクセスします。 レポート リンクを使用すれば、最終ステップまで待たなくても、作成プロセス中にいつでも保存することができます。
|
2. | ビューフィールドの検索 | ここでは、レポートで使用するフィールドを検索し、ビルダーの前のステップである「作成」で選択したビューで指定されているすべてのフィールドにアクセスします。 |
3. | ビューフィールド一覧 | ビルダーの前のステップである「作成」で選択したビューで指定されている一覧から、レポートで使用するフィールドを選択します。一度に複数のフィールドを追加するには、Ctrl/CommandまたはShiftキーを押したままフィールドを選択するだけです。 |
4. | 書式メニュー | ナビゲーションバーのこの部分から、さまざまな書式メニューを使用できます。これにより、ユーザーは、「データ」ステップと「表示」ステップを切り替えることなく、「データ」ステップだけで書式変更をレポートに適用したり、表示をプレビューしたりすることができます。
|
5. | 表の内容に関するフィールド | カラムとロウの一覧にフィールドをドラッグして、レポートの内容を作成します。両方の一覧にフィールドを追加すると、自動的にクロス集計レポートが作成されます。
|
6. | フィールドドロップダウンメニュー | このドロップダウンメニューから、集計、書式、高度な関数、合計、およびその他のオプションをフィールドに適用します。
|
7. | 表のプレビュー | 最終的なレポート表示のプレビューを表示します。表にフィールドを追加する場合、カラムやロウの一覧にフィールドを追加する代わりに、このプレビュー領域にフィールドをドラッグすることもできます。また、フィールドヘッダーを適切な位置にドラッグしてフィールドの順序を変更することもできます。
|
8. | セクションフィールド | レポートでセクションとして使用するフィールドを選択すると、セクションフィールドのそれぞれの値について、表内に分割が作成されます。
|
9. | フィルターフィールド | レポートでフィルターとして使用するフィールドを選択します。これらのフィールドの値は、レポートの作成プロセス中に定義するか、またはユーザープロンプトのままにすることができます。
|
10. | ビルダーを閉じるボタン | このボタンを使用してビルダーを終了します。 |
11. | フィルターパネル | ここで、表のプレビューにおける結果を制限するために、ユーザープロンプトとして定義されたフィルターに値を適用します。ここで適用された値はプレビューの調整にのみ使用され、最終的なレポート表示の調整には使用されません。
|
12. | 分析スタイル | このパネルから、関連するレポートおよびドリルの機能を有効化します。
|
13. | レポートデータ | レポート作成時のベースとなるデータソースおよびビュー名を表示します。フィールドの変更のたびに頻繁にデータベースにクエリーを送信するのではなく、ダミーデータを使用してレポートを作成する場合、ユーザーは、レポート(プレビュー)で返されるロウ(行)を制限し、「自動更新」をオフにすることもできます。
|
14. | ソースフィルター | レポート作成用に選択されたビューにソースフィルターが適用されている場合は、ここにソースフィルターが表示され、有効化または無効化することができます。ユーザーに「アクセスフィルター」ロール権限がない場合、このセクションは表示されません。
|
15. | サブクエリーパネル | このパネルから、サブクエリーを作成したり、サブクエリー間を切り替えたりします。ユーザーに「サブクエリー」ロール権限がない場合、これらのボタンは表示されません。
|
16. | ビューの編集 | ユーザーは、レポート作成に必要な変更を行うために、このボタンからビューにアクセスすることができます。ユーザーに適切な「データベースビュー」ロール権限がない場合、このボタンを使用することはできません。 |
17. | 計算の追加 | ユーザーは、レポート内で使用する計算フィールドを作成することができます。ユーザーのロール権限によっては、フリーハンドSQL計算式の作成やビルダーインターフェースの使用が可能です。
|
18. | 表のプレビュー情報 | データ件数と、表のプレビューを返すのにかかった時間を表示します。
|
19. | レポートの更新 | 表のプレビューに表示されるデータを更新します。
|
レポートデータ
| Styleclass | ||
|---|---|---|
| ||
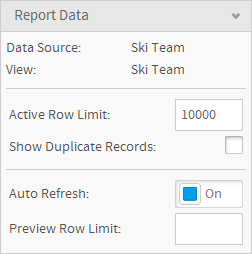
「レポートデータ」パネルには、レポートのソースに関連する情報およびロウ(行)やプレビューに適用可能な設定が表示されます。
オプション | 説明 |
|---|---|
データソース | レポートの作成に使用されるデータベース接続名が表示されます。 |
ビュー | レポートの作成に使用されるビュー名が表示されます。 |
有効なロウ(行)数の制限 | ユーザーに有効なレポートで返されるロウ(行)数を制限するオプションが提供されます。このオプションはソース接続から継承されますが、レポートレベルでさらに制限することができます。 |
重複レコードを表示 | このオプションを使用すると、ユーザーはSQLからDISTINCT節を削除することができます。つまり、複数回出現する結果は削除されずに最終的なレポートに表示されることになるため、同一のロウ(行)が表示される可能性があります。 |
自動更新 | このオプションを使用すると、ユーザーは「自動更新」オプションを「オン」または「オフ」にすることができます。「自動更新」では、表のプレビューにおけるサンプルデータの生成方法が制御されます。
|
プレビューのロウ(行)数制限 | このオプションを使用すると、ユーザーは、表のプレビューに表示されるロウ(行)数を定義することができます。 |
表のプレビュー
| Styleclass | ||
|---|---|---|
| ||
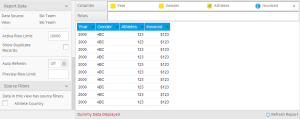
レポートがどのように表示されるかがスナップショットで示されます。表のプレビューで表示されるロウ(行)数は制限されており、オプションでダミーデータを使用することもできます。
ダミーデータ
以下の図では、レポートにデータを投入してレイアウトと書式のプレビューを表示するために、システムによりモックデータが生成されています。ユーザーは、ページの右下にある「レポートの更新」設定を使用して、データを手動で更新することができます。
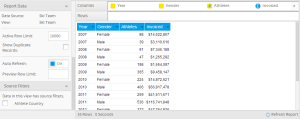
実際のデータ
以下の図では、データベースにクエリーを送信することにより、実際のデータが使用されて表示されています。プレビューパネルの左下隅に、返されたロウ(行)数と、クエリーにかかった時間も表示されます。
フィルターのプレビュー
| Styleclass | ||
|---|---|---|
| ||
「データ」ステップの「フィルター」一覧にフィールドが追加されると、ページの右側にあるフィルターパネルが使用可能になります。このフィルターパネルは、「ダッシュボード」ページや「レポート表示」ページでのフィルターのように機能し、特定のフィルター値が表のプレビューに与える影響をプレビューすることができるように設計されています。
注意:ここで定義されるのはビルダーの「データ」ステップでの表のプレビューを対象としたフィルター設定や値のみであり、有効なレポート表示の設定や値は定義されません。
ソースフィルター
| Styleclass | ||
|---|---|---|
| ||
レポートに表示される結果をそれぞれのユーザーにユニークなものにするためにはソースフィルターを使用します。表示されるデータをその閲覧者の個人的なものにすることが可能です。
レポートのビューで使用可能なソースフィルターが存在する場合、ここで有効化または無効化することができます。これらの設定はロウレベルのセキュリティに使用されるため、表示するためにはユーザーに必要なロール権限がなくてはなりません。
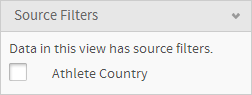
詳細については、 ソースアクセスフィルター を参照してください。
...
Field Types
| Styleclass | ||
|---|---|---|
| ||
When creating a VIEW, the administrators define and categorise fields. The definition of a field reveals how it can be used in analysis and reports. A field can be defined as a dimension or a metric. Each type of field serves a different purpose:
Dimension fields retrieve the data that will provide the basis for analysis in a report. Dimensions typically retrieve character-type data (employee names, company names, etc.), or dates (years, quarters, etc.) | |
Metric fields retrieve numeric data that is the result of calculations on data in the database. | |
Pre-Defined Filters are fields where a set of conditions have been set up when the view was created. This assists users to limit the data returned in a query to only the expected results. For example if the filter is called 'United States' then only data from the united states would be included in the results. | |
Parameters are fields which are used to capture user defined values and pass them into calculated fields or filters. These parameters can assist in conducting what if analysis. |
View Fields Information
| Styleclass | ||
|---|---|---|
| ||
A common issue when using a report writer is to understand what the fields that you can select from actually mean in your business context.
Yellowfin makes this easy with view meta data. When your administrator creates a view they also provide a long description for each field contained in it.
To see the long description click the view name located at the bottom of the data fields panel. It will open up a view popup. This popup provides you with a summary of the view, its attributes, and the users that have access to it.
Adding a Field
| Styleclass | ||
|---|---|---|
| ||
To include a field onto your report simply drag the field from the data fields panel to a column field on your report. Click on a field in your data field list and holding down the mouse button drag the field onto the report data section.
Your drag and drop is successful when you see the field you have selected turn transparent and move along with your mouse pointer. The order that fields appear in the data list will determine the order of data columns in your report.
Deleting a Field
| Styleclass | ||
|---|---|---|
| ||
To delete a field from your report you will have to remove the object from the Report Data Section that it is placed in.
- Click on the field that you wish to remove
- Once highlighted drag the object out of the edit box and off the main page data page and let go of it.
- The field should no longer be displayed in the report data list. The attribute is now removed from the report.
Data Validation Prompts
| Styleclass | ||
|---|---|---|
| ||
Data validation checks are made by Yellowfin to ensure you are building your report the way in which the administrator intended. You will be prompted if you have used fields and filters incorrectly with the following messages:
Mandatory
The fields shown in this type of message must be included into the field or filter section of the report. For example:
A variation of the mandatory field section validation is when a selected field in the table is being aggregated by sum or average. Constraints can be set when this occurs so that meaningful data is presented in the report. The validation message will look like this:
To proceed with your report you can remove the sum or average aggregation on the selected field or drag the relevant fields indicated in the validation message into the report.
Excluded
The fields shown in this type of message must not be included into the field or filter section of the report when a selected field in the table is being aggregated by sum or average. Constraints can be set when this occurs so that meaningful data is presented in the report. The validation message will look like this:
To proceed with your report you can remove the sum or average aggregation on the selected field or remove the relevant fields indicated in the validation message out of the report.
Suggested
When a suggested field or filter occurs, a messages box will appear with the suggestion. The user can chose to include this field or filter into the report or to ignore the suggestion.
In list
When constraints are set up on a report, one of the options is to select a few fields from a table and set the constraint as one in list. This means that at least one of the selected fields must be included in the report. When this validation message is displayed it will show the list of all the fields where at least one must be included in the report. To fulfil this constraint simple make sure one of these fields are included in the report.
...
| horizontalrule |
|---|
| Styleclass | ||
|---|---|---|
| ||