Page History
...
| Table of Contents | ||
|---|---|---|
|
...
概要
| Styleclass | ||
|---|---|---|
| ||
Yellowfin is an easy-to-use report writer for non-technical users, delivering drag-and-drop simplicity for formatting and data selection. With Yellowfin, you can access information from multiple data bases without special coding knowledge. This is easy because you work with data in business terms that are familiar to you without the need to understand complex technology principles.
...
Yellowfinは、ドラッグ&ドロップインターフェースを備え、コンピュータの知識のないユーザーでも簡単にご利用になれるソフトウェアです。
データはどこから?
| Styleclass | ||
|---|---|---|
| ||
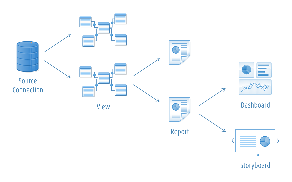
Yellowfin makes it easy to access data for your reports because it uses what is called a meta-data layer that hides the technical issues of the underlying database. Generally you do not need to know much about the meta-data layer, only that it is there and is referred to as a View (since it provides you with a view of your data).
The View is created by your Yellowfin Administrator and maps to data in your database, using everyday business terms. This makes it easy to select the data you want for your report through user-friendly drag and drop interface. You will learn more about the report writer later.
Views consist of categories and items. The categories are logical groupings of items. For example in a human resource view the category of PERSONAL DETAILS could consist of items including last name, date of birth and gender.
When you build a report, you select items from a view, and then run a query. Yellowfin connects to the database, and retrieves the data mapped by the items you selected.
...
Yellowfinでは、管理者が設定したソース接続によってデータに接続します。上級ユーザーはこれらのデータからビューを設計および作成します。ビューは、データベースでの関係とフィールドの可用性を指定するために使用される、メタデータレイヤーです。
ビューにより提供されるフィールドを使用すれば、レポート作成者は、データベースの関係を技術的にすべて理解していなくてもレポートを作成できます。また、レポート作成者は、インターフェースをドラッグ&ドロップして、コンテンツを自由に作成できます。
ユーザーがレポートを実行すると、レポートはビューで定義されたロジックを使用し、ソース接続を使用してデータベースに接続して、結果を返します。
レポートで実行できること
| Styleclass | ||
|---|---|---|
| ||
Yellowfin is very secure. Your administrator has many options for managing security profiles. All of the rights you have as a user are granted by your administrator. The administrator defines:
- The parts of the Yellowfin interface you can access. Your administrator can restrict the availability of Yellowfin functionality, such as access to certain menu commands;
- The Categories and Subcategories of reports that you can access;
- The views you can access for creating and editing queries;
- Your ability to publish public reports; and
- The data that you can access
The permissions assigned to each user define the content they can see and the functionality they can access. This profile-based security system allows a single report to be distributed to many users - with end users having access only to the information that they are authorised to see.
...
レポート作成者はYellowfinを使用してさまざまなタイプのレポートを作成できます。レポートのタイプには、基本的なテーブル形式レポート、グラフ、およびKPIから、高度な地図や複数ソースの結果を組み合わせることができるレポートまであります。
レポートでは以下のような機能を使用できます:
- ドリルダウン- 画面操作により、高レベルのデータの概要から取引別の詳細までレポート内を移動できます。
- アラート- レポートでは、レポート作成者が定義したルールに基づいて強調表示することによって、ユーザーの注意を値に向けることができます。
- 計算- レポートには基本的な計算から非常に複雑な計算まで含めることができます。計算は「ビュー」または「レポート」で定義できます。
- フィルター- フィルター - レポートでは、Report WriterまたはReport Readerが定義したフィルターを使用して、返される結果を制限できます。
- グラフ - レポートには、レポートビルダーで定義した広範なグラフを含めることができます。これにより、ユーザーはテーブル形式以外でデータを表示できます。
- KPI &サマリー - レポートには、重要な値に迅速にアクセスできるKPIまたはサマリーを含めることができます。ユーザーはそこからさらに詳しく調べることができます。
はじめに
| Styleclass | ||
|---|---|---|
| ||
Using Yellowfin you can create many types of reports to suit your reporting needs. These can vary from basic tabular reports to far more advanced varieties.
- With Yellowfin you may be able to create and distribute reports that are "drillable." This means that other users can simply click on values in the report to see more detail as they feel they need it, without having to run the query all over again.

- You can set up a report to include calculations and Conditional Formats.

- You can include prompts that let you obtain just the information you need, and filter out the rest.

- You can choose from a wide variety of chart formats to represent the data. If you think another graphical format would make the data clearer, you can change the format in a couple of mouse clicks:

はじめに ページに移動して、Yellowfinの使用を開始してください。
| horizontalrule |
|---|
| Styleclass | ||
|---|---|---|
| ||