Page History
| Anchor | ||||
|---|---|---|---|---|
|
| Table of Contents | ||
|---|---|---|
|
...
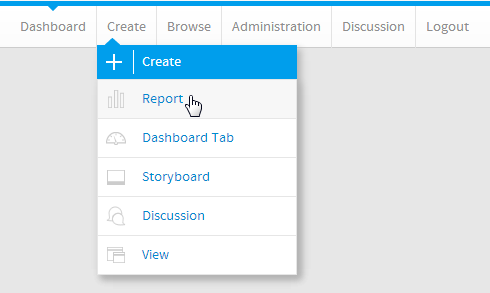
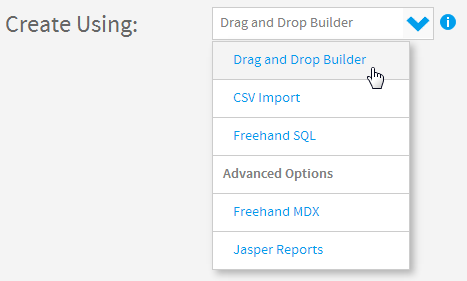
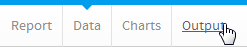
レポートの作成
| Styleclass | ||
|---|---|---|
|
...
| Section | ||||||||||
|---|---|---|---|---|---|---|---|---|---|---|
|
| Section | ||||||||||
|---|---|---|---|---|---|---|---|---|---|---|
|
| Section | ||||||||||
|---|---|---|---|---|---|---|---|---|---|---|
|
...
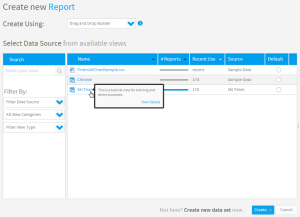
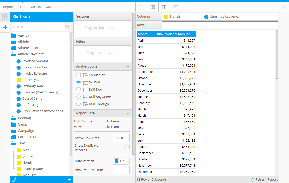
データ設定
| Styleclass | ||
|---|---|---|
|
...
| Section | ||||||||||
|---|---|---|---|---|---|---|---|---|---|---|
|
...
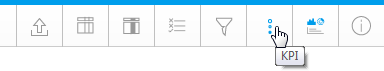
KPI設定
| Styleclass | ||
|---|---|---|
|
...
| Section | ||||||||||
|---|---|---|---|---|---|---|---|---|---|---|
|
| Section | ||||||||||
|---|---|---|---|---|---|---|---|---|---|---|
|
Time
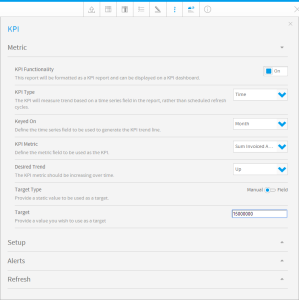
時間
KPIレポートでは、標準レポートでは必要のない複数のコンポーネントを定義する必要があります。最初に、監視対象となるメトリック(数値)を設定する必要があります。KPI reports require several components to be defined that are not required by standard reports. The metric to be monitored must be configured first.
| Section | ||||||||||
|---|---|---|---|---|---|---|---|---|---|---|
|
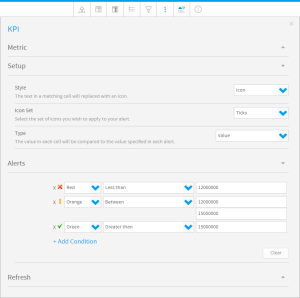
KPI Alerts
KPIアラート
KPIレポートに必要な次のコンポーネントは、ダッシュボードでKPIの左側に表示される条件付き書式アラートです。このアイコンまたは色によって、値の現在の状態に関するアラートが表示されます。The next component required for KPI reports is the Conditional Formatting Alerts displayed to the left of the kpi on the Dashboard. This icon or colour displays an alert for the current status of the value.
| Section | ||||||||||
|---|---|---|---|---|---|---|---|---|---|---|
|
...
レポートの保存
| Styleclass | ||
|---|---|---|
|
...
| Section | ||||||||||
|---|---|---|---|---|---|---|---|---|---|---|
|
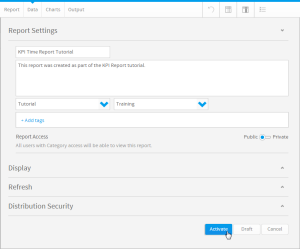
Your KPI report is now complete and ready to be added to a KPI Dashboard Tab.
...
KPIレポートが完成し、KPIダッシュボードタブに追加する準備ができました。
詳細については、KPIタブを参照してください。
| horizontalrule |
|---|
| Styleclass | ||
|---|---|---|
| ||
...