Page History
...
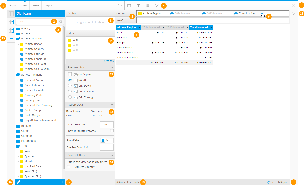
The Report Data page is where you build, edit and view the report data definitions used to generate Yellowfin reports. These definitions include both the queries you use to retrieve data for your document, and the data formatting.
You can easily add data to an empty report by dragging and dropping the report fields from the available data fields list.
- Navigation: The process step guide provides you with a visual display of the steps required in your report builder wizard. The number of steps displayed will vary based on some of your selections on this screen - for example if you choose to include a chart on the report.
- Search: The Search box allows you to quickly find a field for your report when instead of browsing through the categories.
- Data Fields: The Data Fields display provides you with a list of all available fields to add to your report from the selected view. Click on the folder expand image to open the folder and view all the fields within it.
- Calculations: You can create calculated columns that are unique for the current report.
- Source: The current data source and view name is displayed. Click on the view name to view a summary of the view.
- Resize: Used the drag icon to resize the Data Fields panel to make it easier to read the column names you wish to add to your report.
- Data: The report data section is used to specify which fields you wish to include in your report. Drag a field from the report field list and into the report column. The calculation buttons allow you to perform calculations on metrics included in your report.
- Filters: Filters allow you to specify which attributes should provide a filter such as date - only show events that have occurred today.
- Sections: The report section area allows you to create sections in your report based upon dimension data. An example may be that a new section is created based upon Business Unit.
- Report Options: The report options section provides you with advanced functions for manipulating the output of your report. Options include: Charts, Crosstab Display, Totals etc. Click on the expand image to open the various sections available to you.
Categories & Fields
| Styleclass | ||
|---|---|---|
| ||
The data fields section on the left hand side of the Report Data page provides you with a list of all possible fields that can be used in your report and grouped into useful categories. These fields relate back to the data in the database and in some cases have already had some manipulation occur to them - this is especially likely for metric type fields.
...
| Column | ||
|---|---|---|
| ||
...
| width | 90% |
|---|
...
- Navigation
- View Fields Search
- View Fields List
- Formatting Menus
- Table Body Fields
- Field Drop Down Menus
- Table Preview
- Section Fields
- Filter Fields
- Close Builder Button
- Filter Panel
- Analysis Style
- Report Data
- Source Filters
- Sub Query Panel
- Edit View
- Add Calculation
- Table Preview Info
- Refresh Report
...
Field Types
| Styleclass | ||
|---|---|---|
| ||
When creating a VIEW, the administrators define and categorise fields. The definition of a field reveals how it can be used in analysis and reports. A field can be defined as a dimension or a metric. Each type of field serves a different purpose:
Dimension fields retrieve the data that will provide the basis for analysis in a report. Dimensions typically retrieve character-type data (employee names, company names, etc.), or dates (years, quarters, etc.) | |
Metric fields retrieve numeric data that is the result of calculations on data in the database. | |
Pre-Defined Filters are fields where a set of conditions have been set up when the view was created. This assists users to limit the data returned in a query to only the expected results. For example if the filter is called 'United States' then only data from the united states would be included in the results. | |
Parameters are fields which are used to capture user defined values and pass them into calculated fields or filters. These parameters can assist in conducting what if analysis. |
View Fields Information
| Styleclass | ||
|---|---|---|
| ||
A common issue when using a report writer is to understand what the fields that you can select from actually mean in your business context.
Yellowfin makes this easy with view meta data. When your administrator creates a view they also provide a long description for each field contained in it.
To see the long description click the view name located at the bottom of the data fields panel. It will open up a view popup. This popup provides you with a summary of the view, its attributes, and the users that have access to it.
Adding a Field
| Styleclass | ||
|---|---|---|
| ||
To include a field onto your report simply drag the field from the data fields panel to a column field on your report. Click on a field in your data field list and holding down the mouse button drag the field onto the report data section.
Your drag and drop is successful when you see the field you have selected turn transparent and move along with your mouse pointer. The order that fields appear in the data list will determine the order of data columns in your report.
Deleting a Field
| Styleclass | ||
|---|---|---|
| ||
To delete a field from your report you will have to remove the object from the Report Data Section that it is placed in.
- Click on the field that you wish to remove
- Once highlighted drag the object out of the edit box and off the main page data page and let go of it.
- The field should no longer be displayed in the report data list. The attribute is now removed from the report.
Data Validation Prompts
| Styleclass | ||
|---|---|---|
| ||
Data validation checks are made by Yellowfin to ensure you are building your report the way in which the administrator intended. You will be prompted if you have used fields and filters incorrectly with the following messages:
Mandatory
The fields shown in this type of message must be included into the field or filter section of the report. For example:
A variation of the mandatory field section validation is when a selected field in the table is being aggregated by sum or average. Constraints can be set when this occurs so that meaningful data is presented in the report. The validation message will look like this:
To proceed with your report you can remove the sum or average aggregation on the selected field or drag the relevant fields indicated in the validation message into the report.
Excluded
The fields shown in this type of message must not be included into the field or filter section of the report when a selected field in the table is being aggregated by sum or average. Constraints can be set when this occurs so that meaningful data is presented in the report. The validation message will look like this:
To proceed with your report you can remove the sum or average aggregation on the selected field or remove the relevant fields indicated in the validation message out of the report.
Suggested
When a suggested field or filter occurs, a messages box will appear with the suggestion. The user can chose to include this field or filter into the report or to ignore the suggestion.
In list
When constraints are set up on a report, one of the options is to select a few fields from a table and set the constraint as one in list. This means that at least one of the selected fields must be included in the report. When this validation message is displayed it will show the list of all the fields where at least one must be included in the report. To fulfil this constraint simple make sure one of these fields are included in the report.
...
| horizontalrule |
|---|
| Styleclass | ||
|---|---|---|
| ||