Page History
...
| Table of Contents | ||
|---|---|---|
|
...
概要
| Styleclass | ||
|---|---|---|
| ||
Most of the formatting options available to you are accessed through the report and chart format menu. However, once your report has been generated you can use some drag and drop formatting options to change the layout of your report.
書式に関するオプションのほとんどは、レポートとグラフの書式メニューによって設定可能です。しかしながら、いったんレポートを作成してしまえばドラッグ&ドロップによって調整可能な項目もあります。
ドラッグ&ドロップによる調整が可能なのはドラフト(編集中)モードのレポートのみです。有効化されたレポートではこれらの機能は使用できません。The drag and drop formatting are only available whilst a report is in DRAFT mode. If the report is ACTIVE you will not see these options.
Resize Charts
| Styleclass | ||
|---|---|---|
| ||
Charts can be resized whilst your report is in draft mode. This allows you to determine the exact fit of the chart on your report.
- When in DRAFT a chart will have a resize icon in the bottom right hand corner. Click the icon and hold.
- Drag your chart into the size that you require. A transparent version of the chart will show you a representation of the chart size.
- Let go of the cursor to set the chart size
...
グラフは、ドラフト(編集中)モードのとき、ドラッグ&ドロップでリサイズできます。グラフをレポートに適した大きさに調整できます。
- 編集中のグラフには右下にリサイズアイコンが表示されています。これをクリックしてください。
- そのまま希望のサイズまでドラッグしてドロップします。ドラッグ中は半透明なグラフが表示され、グラフのサイズを確認できます。
- ページが書き換えられてグラフのリサイズは完了です。
グラフの配置
| Styleclass | ||
|---|---|---|
| ||
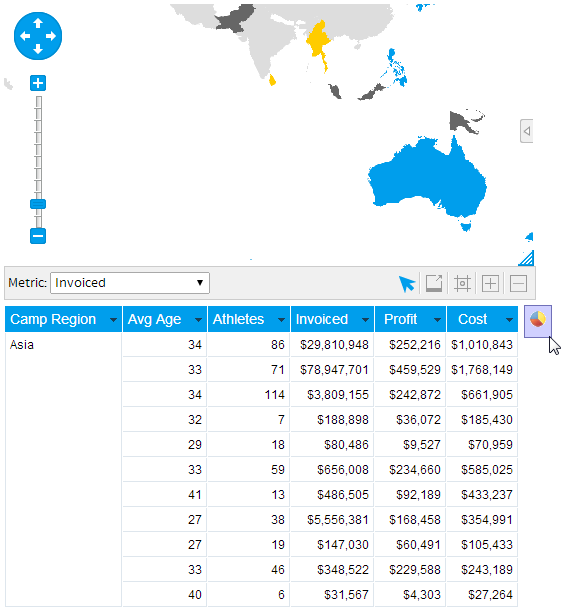
If you have selected table and chart display then you will be able to reposition your chart relative to the table on the report.
表示形式に「表とグラフ」を選択した場合、それらの位置関係をドラッグ&ドロップで変更することができます。
- グラフの非アクティブな領域をクリックしてください(空白領域)。マウスボタンを押したままにしてください。
- そのままドラッグし、たとえば表の横に移動すると、図のように新たなグラフの表示位置がグラフアイコンで示されます。
- マウスボタンを放すとページが書き換えられ、グラフの再配置が完了します。
- Click on a non-active area of the chart. (eg white space) Hold down the cursor.
- Drag your cursor around the table to a point where you wish to place your chart. You will see a small chart icon indicates the position of the chart.
- Let go of the cursor and report will be refreshed with the chart in its new position.
| horizontalrule |
|---|
| Styleclass | ||
|---|---|---|
| ||