Page History
...
| Table of Contents | ||
|---|---|---|
|
...
概要
| Styleclass | ||
|---|---|---|
| ||
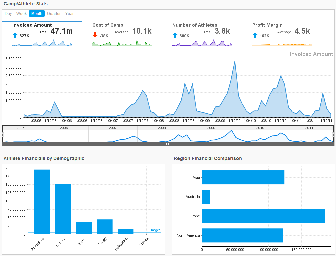
Standard Tabs can be used if you wish to create relationships between multiple reports on a single tab. In a Series Selection Standard Tab you can link reports so that you are viewing the same selectable metric across all linked reports.
...
標準タブは、1つのタブで複数のレポートの関係を作成する場合に使用します。シリーズ選択の標準タブではレポートをリンクさせることができるので、リンクしたすべてのレポートで選択可能な同じメトリック(数値)を表示できます。
レポートのリンク
| Styleclass | ||
|---|---|---|
| ||
First set up a new Standard Tab by following these steps: Creating a Standard Tab. The reports used on the tab must:
- Have Series Selection charts
- At least one of the charts must be restricted to a single metric view of Series Selection. For example, a pie chart, or time series panel selection.
Series Selection Setup
まず、新しい標準タブを設定するために、以下の手順に従います: 標準タブの作成.タブで使用されるレポートの条件は以下の通りです:
- シリーズ選択 グラフが含まれている。
- 少なくとも1つのグラフがシリーズ選択の単一メトリックビューに必ず制限されている。たとえば、円グラフやタイムシリーズのパネル選択です。
シリーズ選択の設定
- 「シリーズ選択の設定」メニュー項目をクリックします。

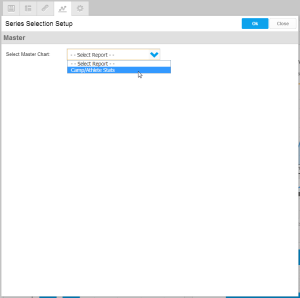
- ここでマスターグラフを定義する必要があります。マスターグラフとは、タブのシリーズ選択を制御するグラフのことです。その他のすべてのグラフからは「シリーズ選択を表示」が表示されなくなります。一度に1つのシリーズを表示するように制限されるグラフは、この一覧で使用可能なグラフのみです。
ドロップダウンメニューからマスターグラフを選択します。
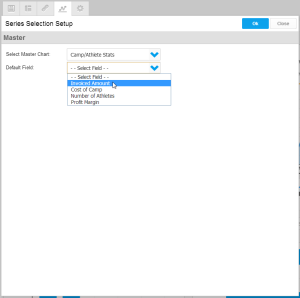
- デフォルトフィールドを選択します。デフォルトフィールドとは、タブが初期ロードされたときにすべてのシリーズ選択グラフに表示されるメトリックです。
デフォルトで表示するフィールドを選択します。
- 「マスター」レポートオプションを定義したら、他のレポートからマスターグラフのシリーズにリンクする必要があります。設定メニューの左側にレポートの一覧が表示され、先頭のレポートが選択されています。
リンクするレポートをクリックします。
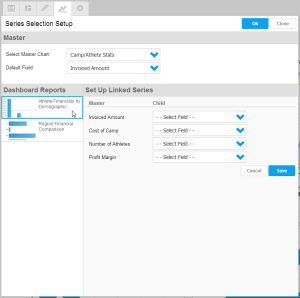
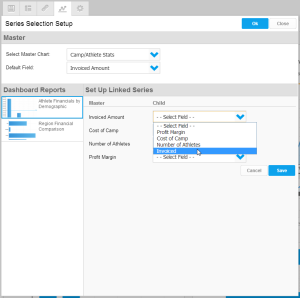
- マスターレポートで使用可能なシリーズの一覧が表示されます。それぞれのシリーズの横には、リンクを設定できるドロップダウンリストが表示されます。同等のシリーズを選択する必要があります。たとえば、マスターグラフに「Invoiced」と表示される場合は、これを他のレポートの「Invoicing」シリーズとリンクしてください。
ドロップダウンリストから同等のシリーズを選択します。
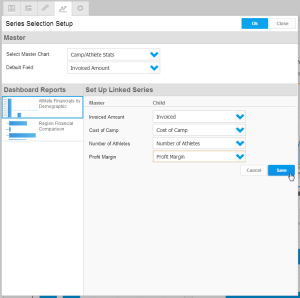
- 「保存」をクリックして、このグラフに作成したリンクを保持します。
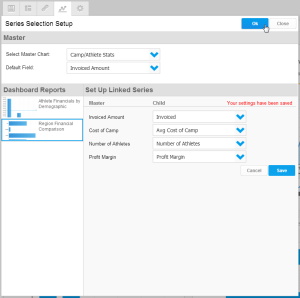
- リンクする他のレポートについて、ステップ4~6を繰り返す必要があります。「OK」をクリックして、処理を完了します。
- Click on the Series Selection Setup menu item
- From here you will need to define the Master Chart. This is the chart that controls the Series Selection on the tab, all other charts will lose their Visible Series Selection display. The only charts available in this lists are charts that are restricted to displaying one series at a time.
Select the Master Chart from the drop down list.
- You will now have the option to select the Default Field. This is the metric that is displayed across all your Series Selection charts when the tab initially loads.
Select the field you wish to display by default.
- Once the Master report options have been defined, you will need to link your other reports to the Master Chart's series. You will see a list of reports displayed on the left side of the setup menu, the first selected.
Click on the report you wish to link.
- You will have a list of series available in the Master Report displayed, with a drop down list next to each that allows you to set up links. You need to select equivalent series. For example, if your Master Chart is displaying 'Invoiced' you should link this to an Invoicing series in your other report.
Select the equivalent series from the drop down lists.
- Click Save to keep the links you've created for this chart
- You will now need to repeat steps 4 to 6 for the other reports you wish to link. Click OK to complete the process.
| horizontalrule |
|---|
| Styleclass | ||
|---|---|---|
| ||